A
A
C
C
S
S
8
8
0
0
6
6
D
D
i
i
g
g
i
i
t
t
a
a
l
l
A
A
C
C
S
S
e
e
r
r
v
v
o
o
d
d
r
r
i
i
v
v
e
e
M
M
a
a
n
n
u
u
a
a
l
l
R
R
e
e
v
v
1
1
.
.
0
0
Tel: (86)755-26434369 34 Website: www.leadshine.com
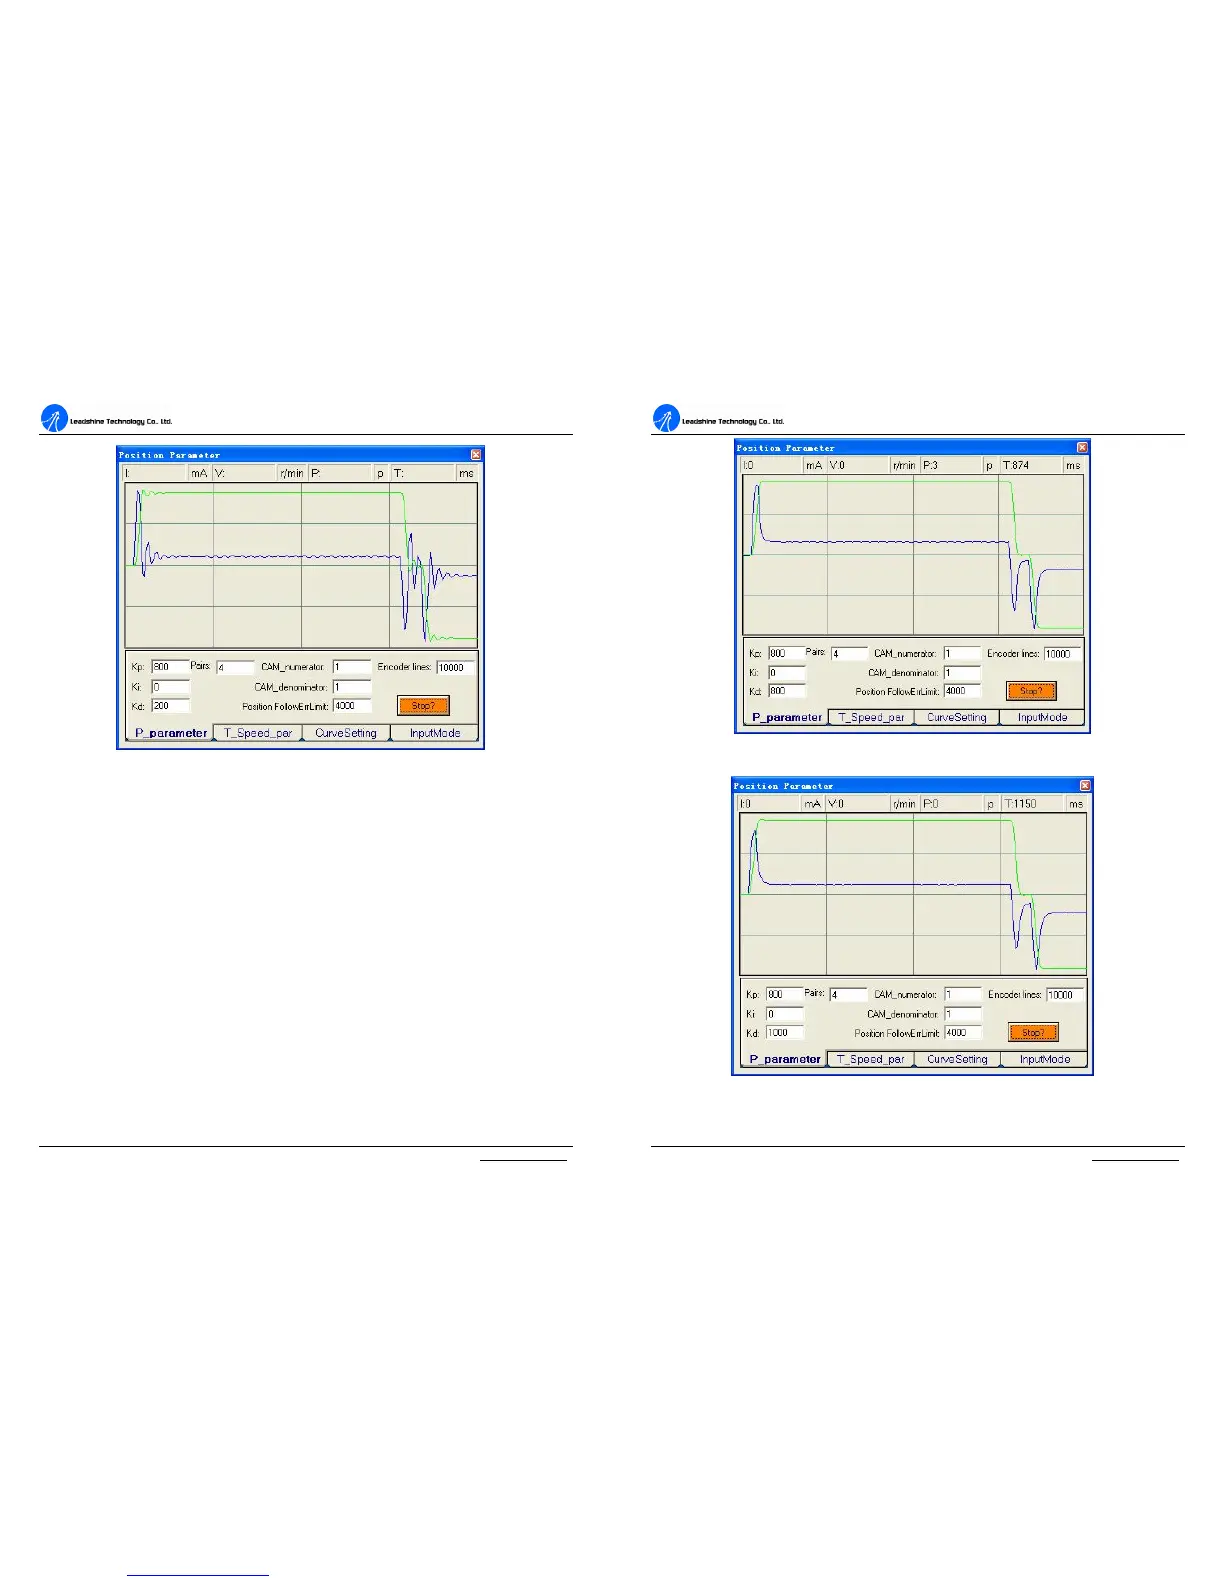
Figure 33: Position following error curve and velocity curve (Kp=800, Ki=0 and Kd=200)
It’s very easy to see from the velocity curve (Green line) that the system is under
damped. This will cause system oscillating beyond either side of its target, so it must
be damped. Figure 26 shows the result after increasing Kd to 800. In the Figure 34,
the oscillation is much smaller than that of Figure 33. You can get even smaller
oscillation when increasing Kd to 1000. See Figure 35.
A
A
C
C
S
S
8
8
0
0
6
6
D
D
i
i
g
g
i
i
t
t
a
a
l
l
A
A
C
C
S
S
e
e
r
r
v
v
o
o
d
d
r
r
i
i
v
v
e
e
M
M
a
a
n
n
u
u
a
a
l
l
R
R
e
e
v
v
1
1
.
.
0
0
Tel: (86)755-26434369 35 Website: www.leadshine.com
Figure 34: Position following error curve and velocity curve (Kp=800, Ki=0 and Kd=800)
Figure 35: Position following error curve and velocity curve (Kp=800, Ki=0 and Kd=1000)