Friedrich Leutert GmbH & Co. KG 33
Digital Pressure Indicator DPI - Bedienungsanleitung
A
B
C
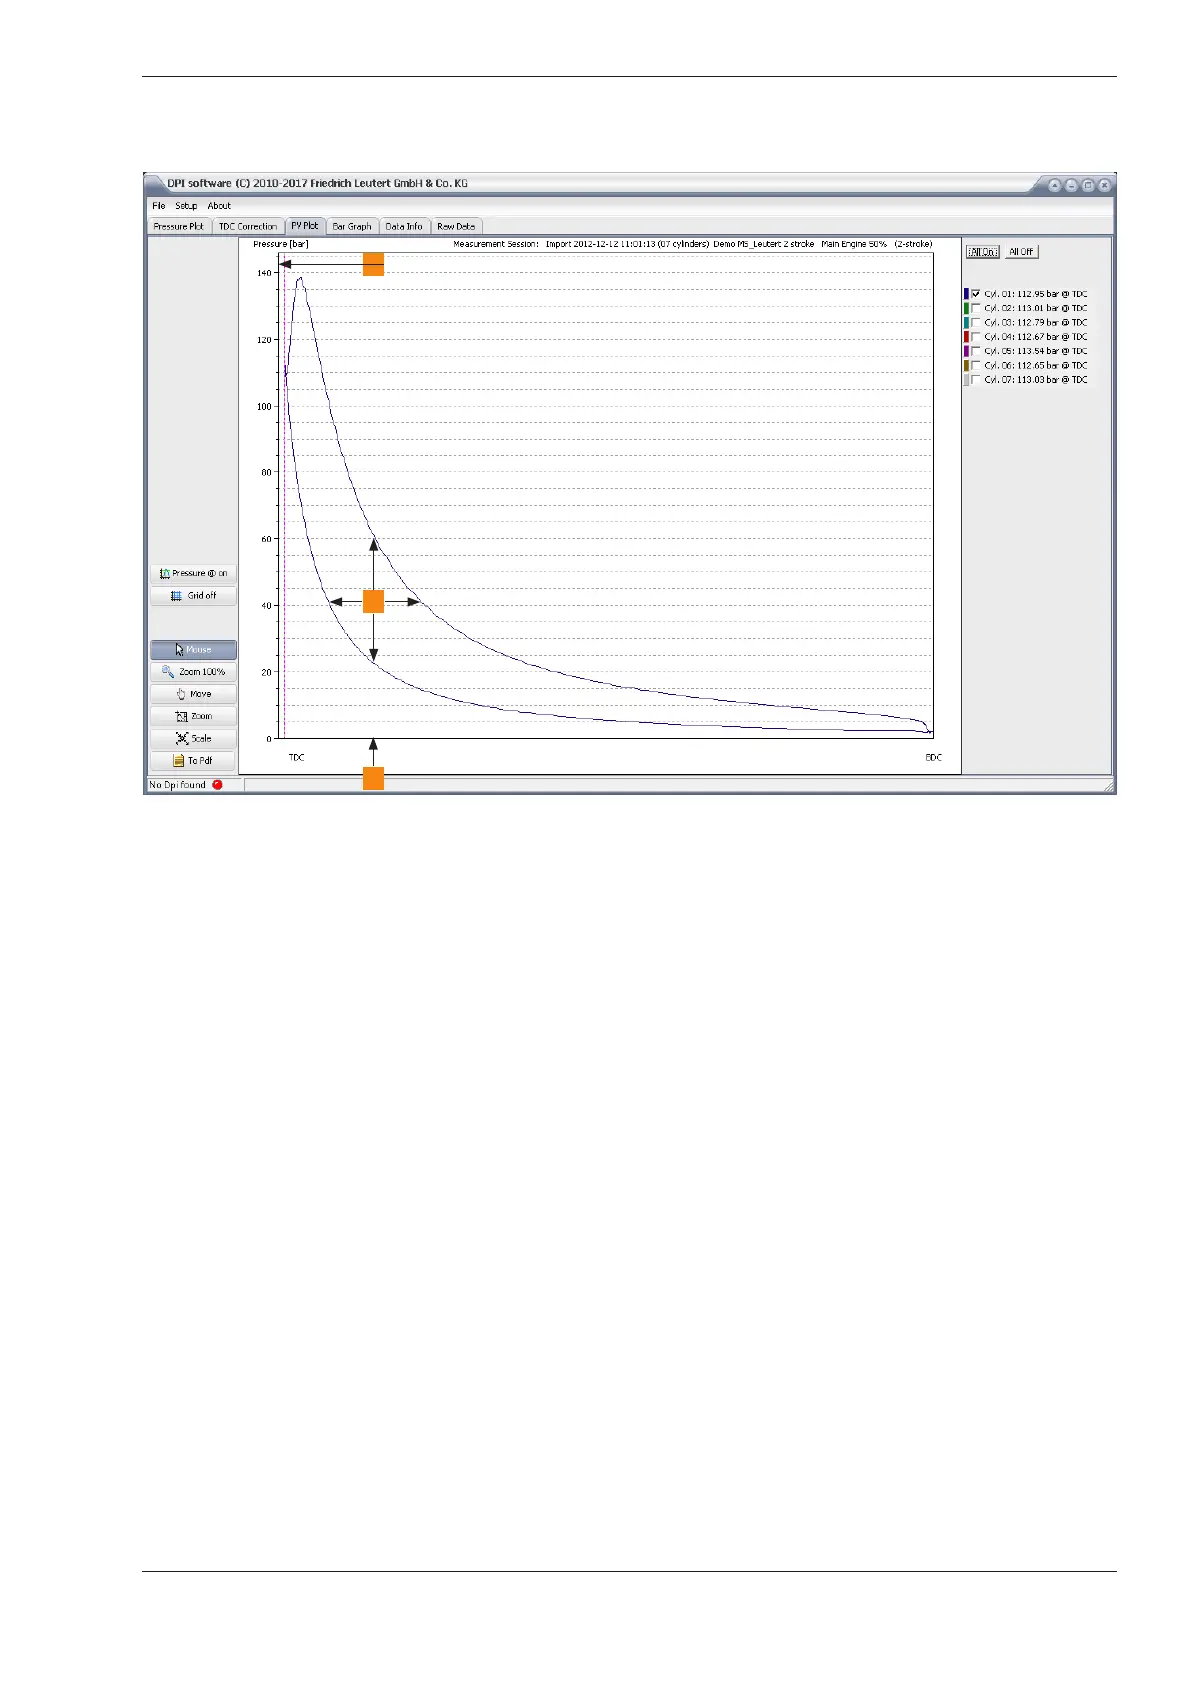
The PV diagram [PV Plot] shows the course of the cylinder pressure bet-
ween top dead center (TDC) and bottom dead center (BDC) during a wor-
king cycle.
A: Axis for the pressure in bar
B: axis for volume change from BDC to TDC
C: The inner area represents the “gain of work”.
In the past the PV diagram, also known as the banana curve, has been
applied to measure the work area and to determine the indicated perfor-
mance by use of a planimeter. Today this procedure is no longer necessary
because the electronic indicator carries out this calculation automatically.