Digital Pressure Indicator DPI - Bedienungsanleitung
32 Friedrich Leutert GmbH & Co. KG
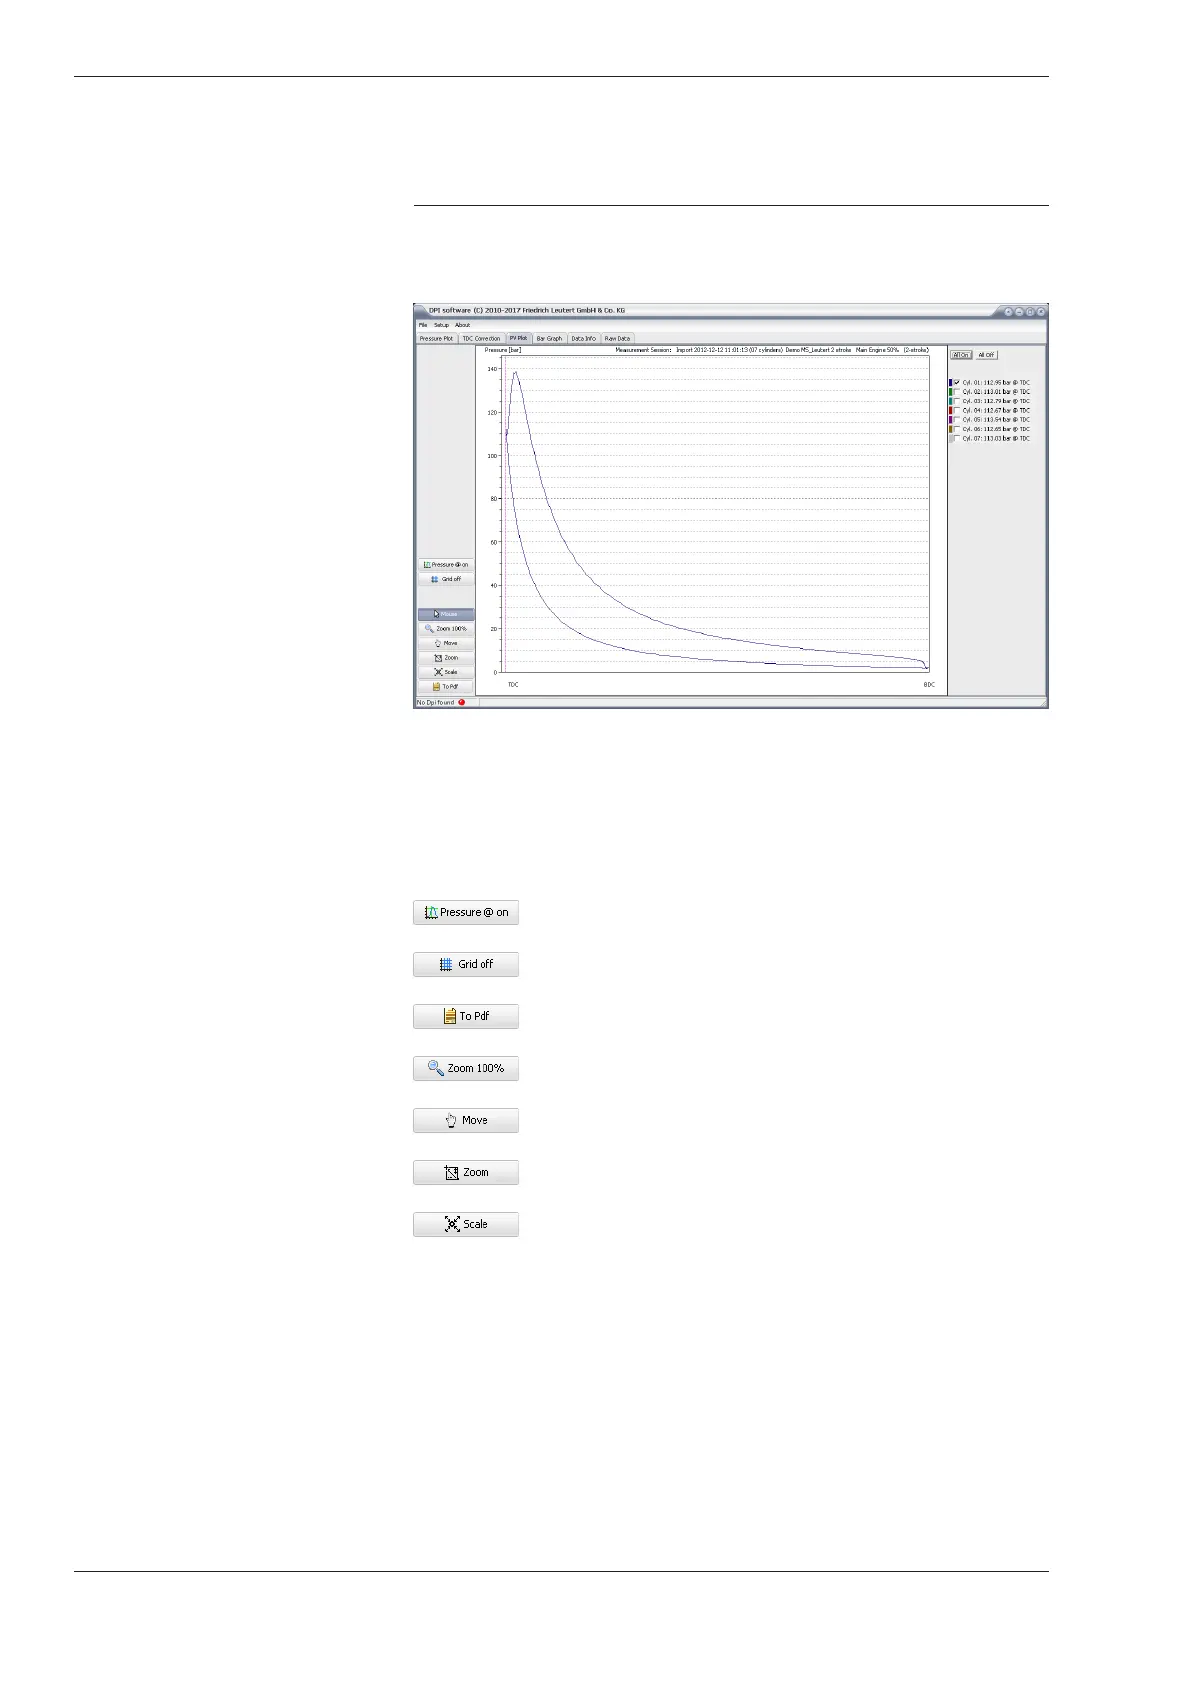
5.2.3 PV Plot
The display mode [PV Plot] illustrates the cylinder pressure in relation
to the volume curve.
The cylinders to be displayed are selected in the right window area.
Available buttons:
Zoom 100% - reset graphics after zooming, scaling or moving
Move - Move the graphic section with the mouse
Toggle Grid - switch on / off grid
Zoom - enlarge an area marked with the mouse
Scale - scale the graphic horizontally and / or vertically
Toggle Crosshair - switch on / off horizontal line for reading the pressure values
Export to pdf - aopen the current view for printing or saving as pdf file