Digital Pressure Indicator DPI - Bedienungsanleitung
34 Friedrich Leutert GmbH & Co. KG
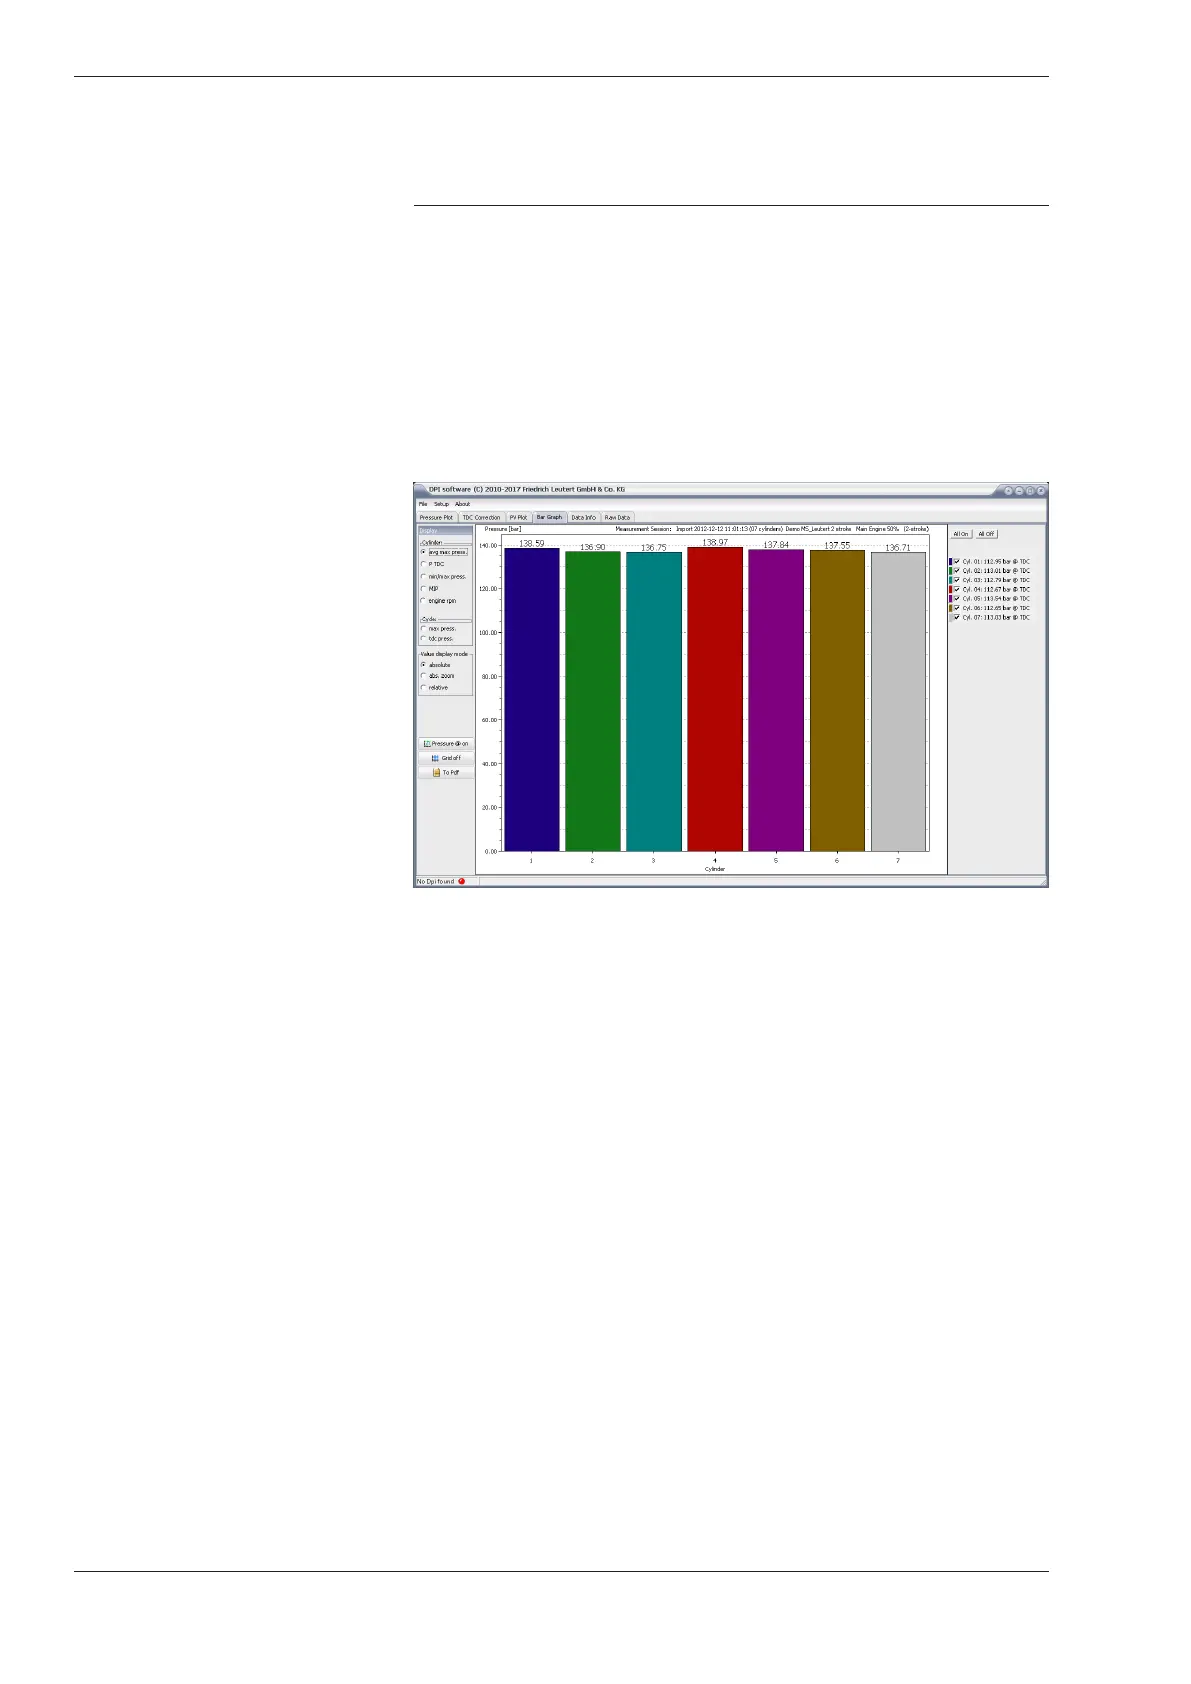
5.2.4 Bar Graph
In the [Bar Graph] mode the selected measurement data is displayed in
form of a bar graph. This view allows you to easily compare the individual
cylinders with each other.
The bar chart below shows a sample data set that shows the maximum
of the combustion pressures for all cylinders with automatic scaling. The
optimum is achieved once the deviation between the cylinders is as small
as possible.
The cylinders to be displayed are selected in the right window area.
In the left window area the following display options are available:
„Cylinder:“
– avg. max press .: Average value of the maximum ignition pressure
– P TDC: pressure at top dead center
– min / max press .: minimum and maximum pressure
– MIP: mean indicated pressure
– engine rpm: engine speed
„Cycle:”
– max press .: maximum pressure per cycle and cylinder
– tdc press .: pressure at top dead center per cycle and cylinder
„Value display mode”
– absolute: display of the absolute values
– abs. zoom: graphic enlarged to the maximum values
– relative: display of the relative deviations