Operating Instructions
25
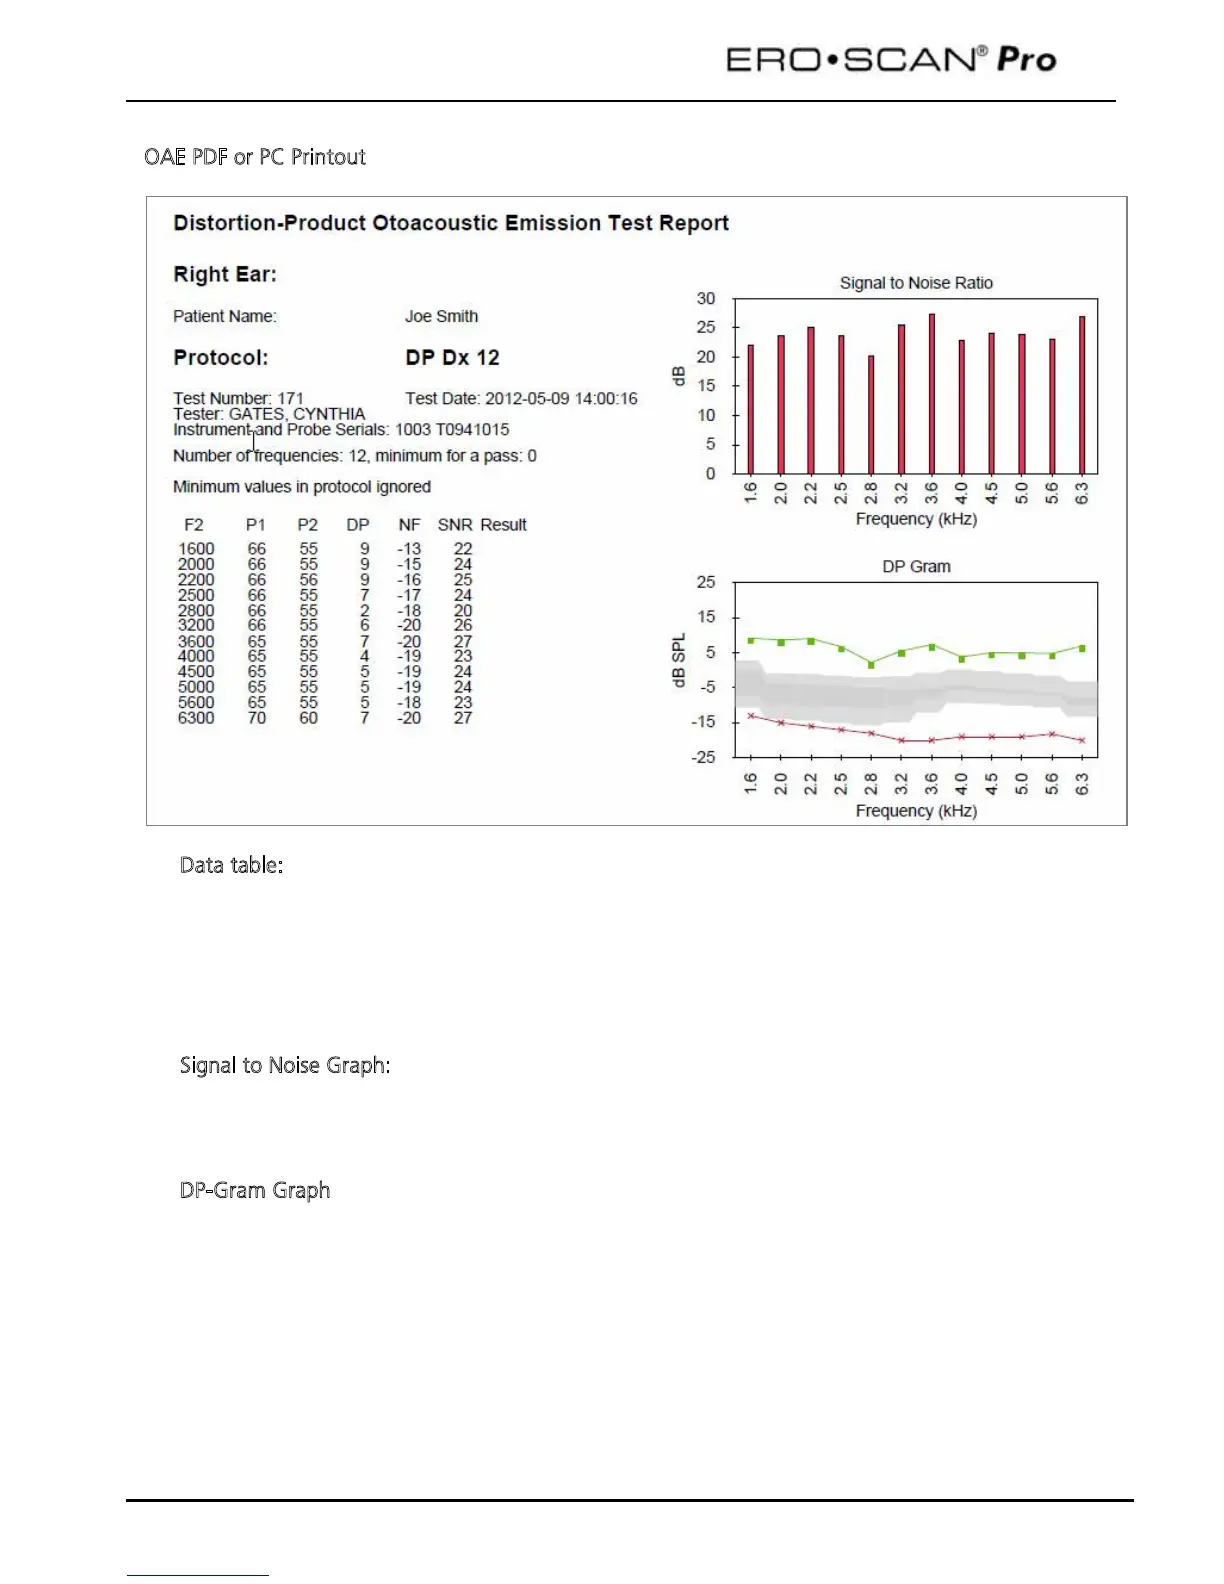
OAE PDF or PC Printout
D
ata table:
F2 = the f2 frequency
P1 = the sound pressure level of f1
P2 = the sound pressure level of f2
DP = the level of the emission in dB SPL
NF = the noise floor in dB SPL
SNR = the signal-to-noise ratio (DP level minus the noise floor)
P = indicates that the pass criteria has been met for the indicated frequency
S
ignal to Noise Graph:
Vertical axis = SNR (dB)
Horizontal axis = f2 frequency tested (Hz)
Green bars indicate that the pass criteria have been met. Red bars indicate that SNR and/or DP
amplitude have not been met.
D
P-Gram Graph
Vertical axis = indicates the absolute value of the signal or noise in dB
Horizontal axis = f2 frequency tested (Hz)
The green line is the signal. The red line is the noise. The difference between the two lines is
the signal-to-noise ratio.
 Loading...