Operating Instructions
26
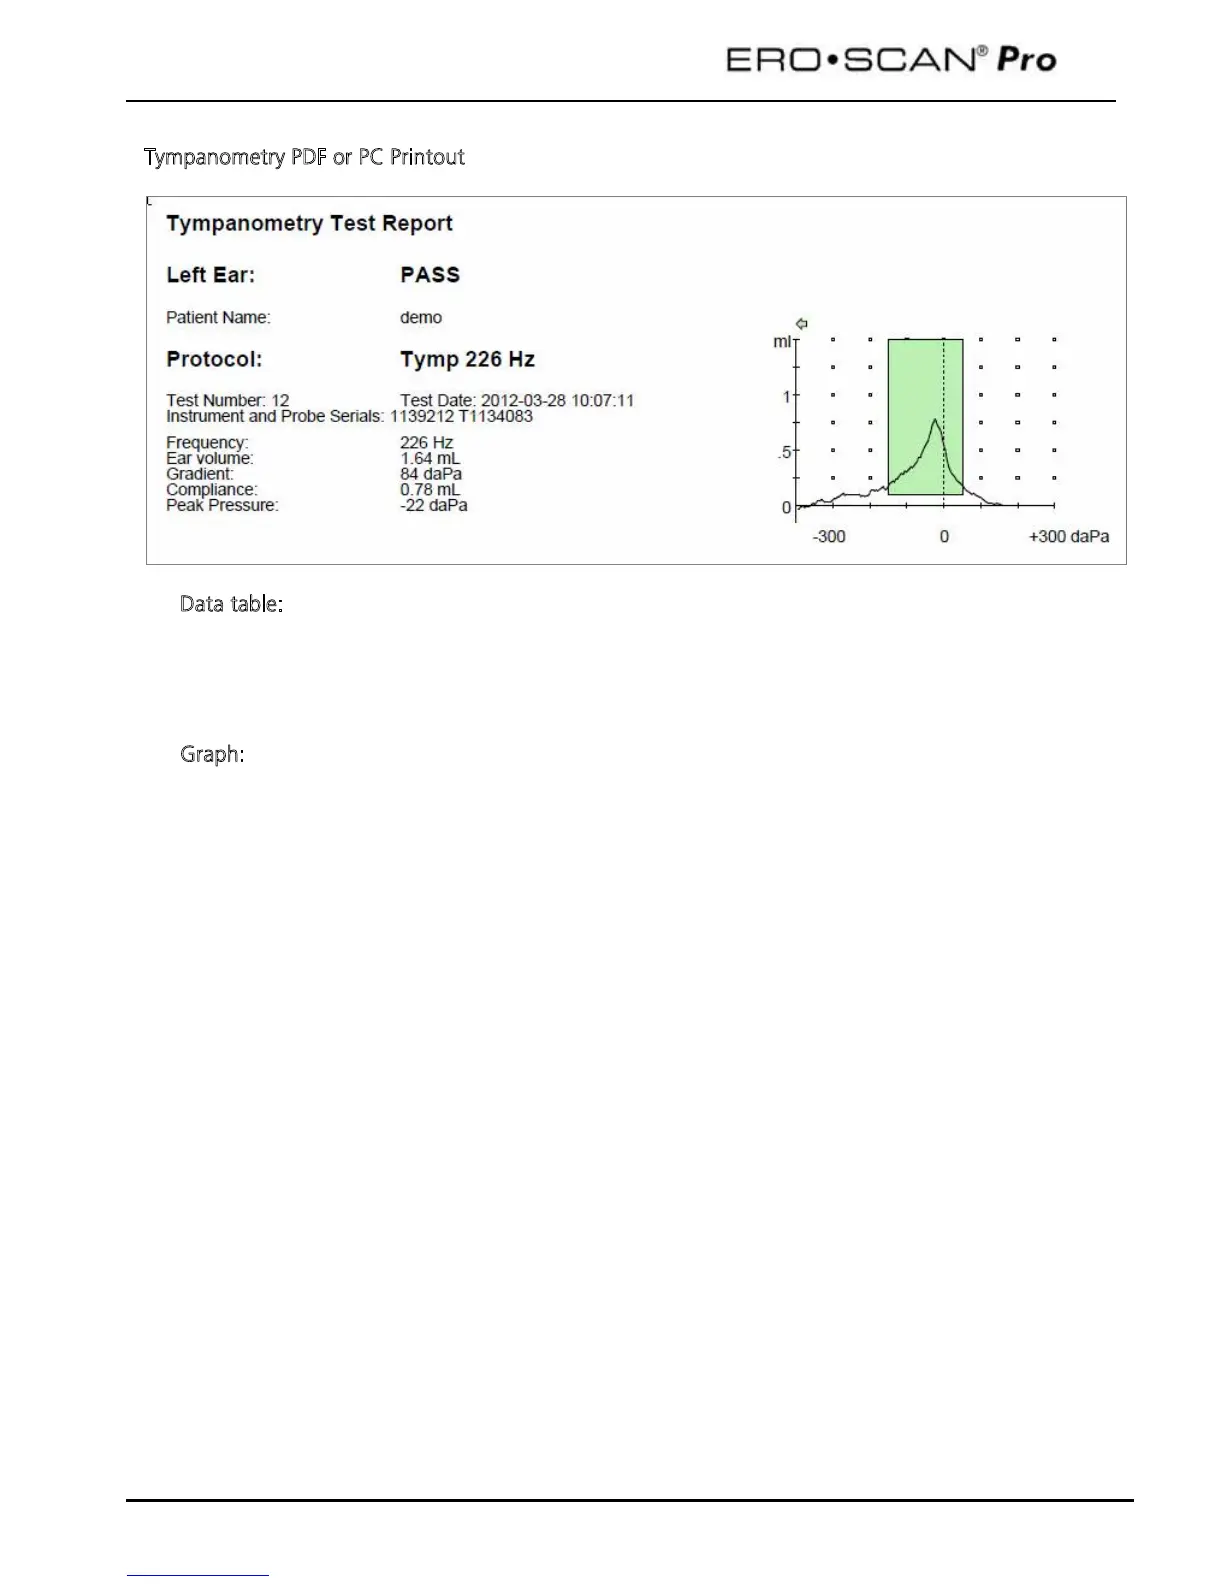
Tympanometry PDF or PC Printout
D
ata table:
Frequency = probe tone frequency (226 or 1,000 Hz)
Ear volume = indicates the volume of the external ear canal
Gradient = indicates graph width in daPa value (tympanometric width at 50% of the peak)
Compliance = displays the peak compliance
Peak Pressure = displays the pressure corresponding to peak compliance
G
raph:
Vertical = relative canal volume (ml) indicated by the arrow and dynamic compliance indicated
by the peak of the curve (ml)
Horizontal = pressure corresponding to peak compliance (daPa)
If the tympanogram is within the preset limits, the peak will be within the box displayed on the
screen and the test result will be
Pass
.

 Loading...