33
OSCILATION
GRAPH
5.5.3
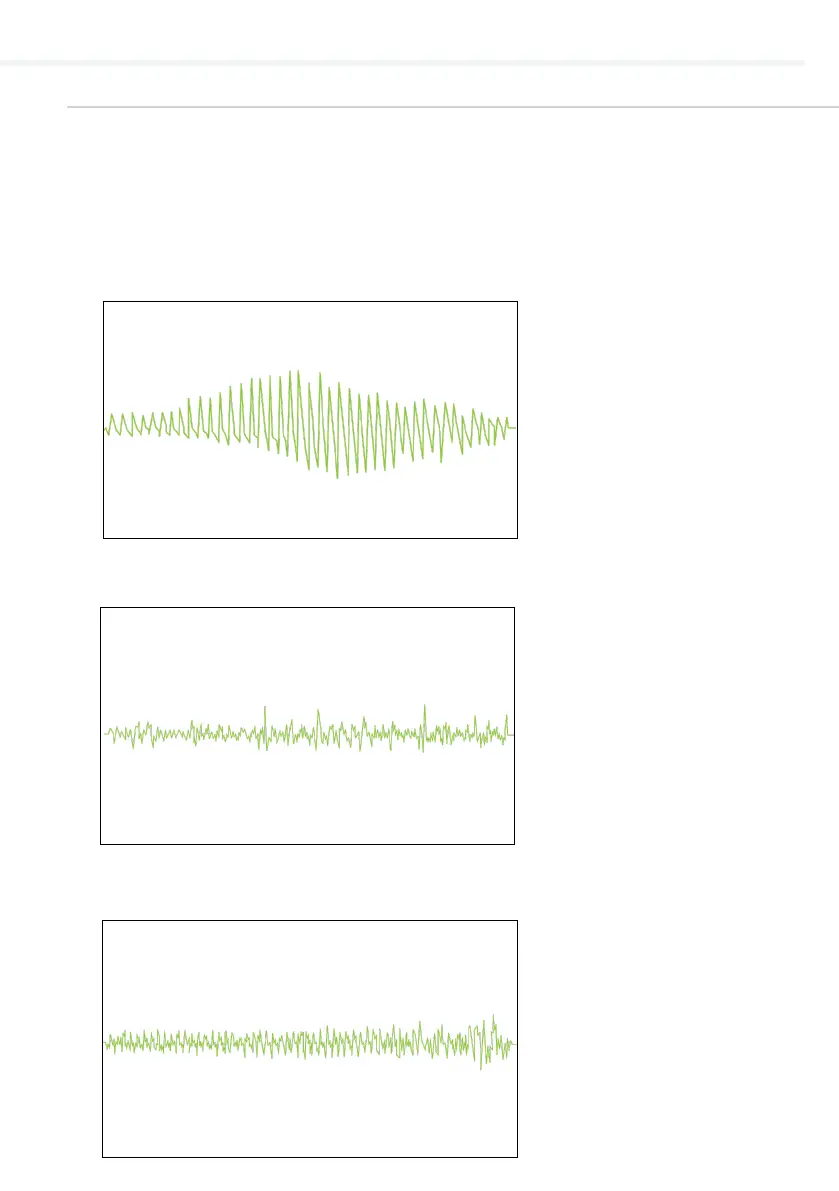
As with the pulse waveform, the MESI ABPI MD result page also
displays oscillation graphs, which provide the user with pulse
waveform analysis throughout the ABI measurement.
Below are a couple of examples of dierent oscillation graphs:
DETAILED INSTRUCTIONS
Normal oscilation graph
Severe PAD oscilation graph
Incompressible arteries oscillation graph