Page 27 of 47
In the latter you can toggle between the options Cal. frozen and Cal. active to determine the
behavior of the voltage output during calibration:
• Cal. frozen: freezes the current output to the last value before calibration in order to avoid
unnecessary jumps during e.g. the logging of the current values.
• Cal. active: shows the actual current output during calibration.
The voltage output settings are, however, found under I/O Mode. Clicking <ENTER> after high-
lighting it opens the menu where the different voltage output modes can be adjusted.
3. Press <ENTER> on the first display line successively until you reach the desired voltage output
mode. (see Table 6.3).
4. Changing the signal’s source: from the second display line where usually Ch. 5 is shown,
the source of the voltage signal can be changed. To change the channel, click <ENTER> key
multiple times to toggle through the channels until you reach the desired channel. (see Table 6.1
for the typical assignment of the channels). The gas measured by thermal conductivity is routed
to channel 5 (displayed as e.g. Ch5. H2).
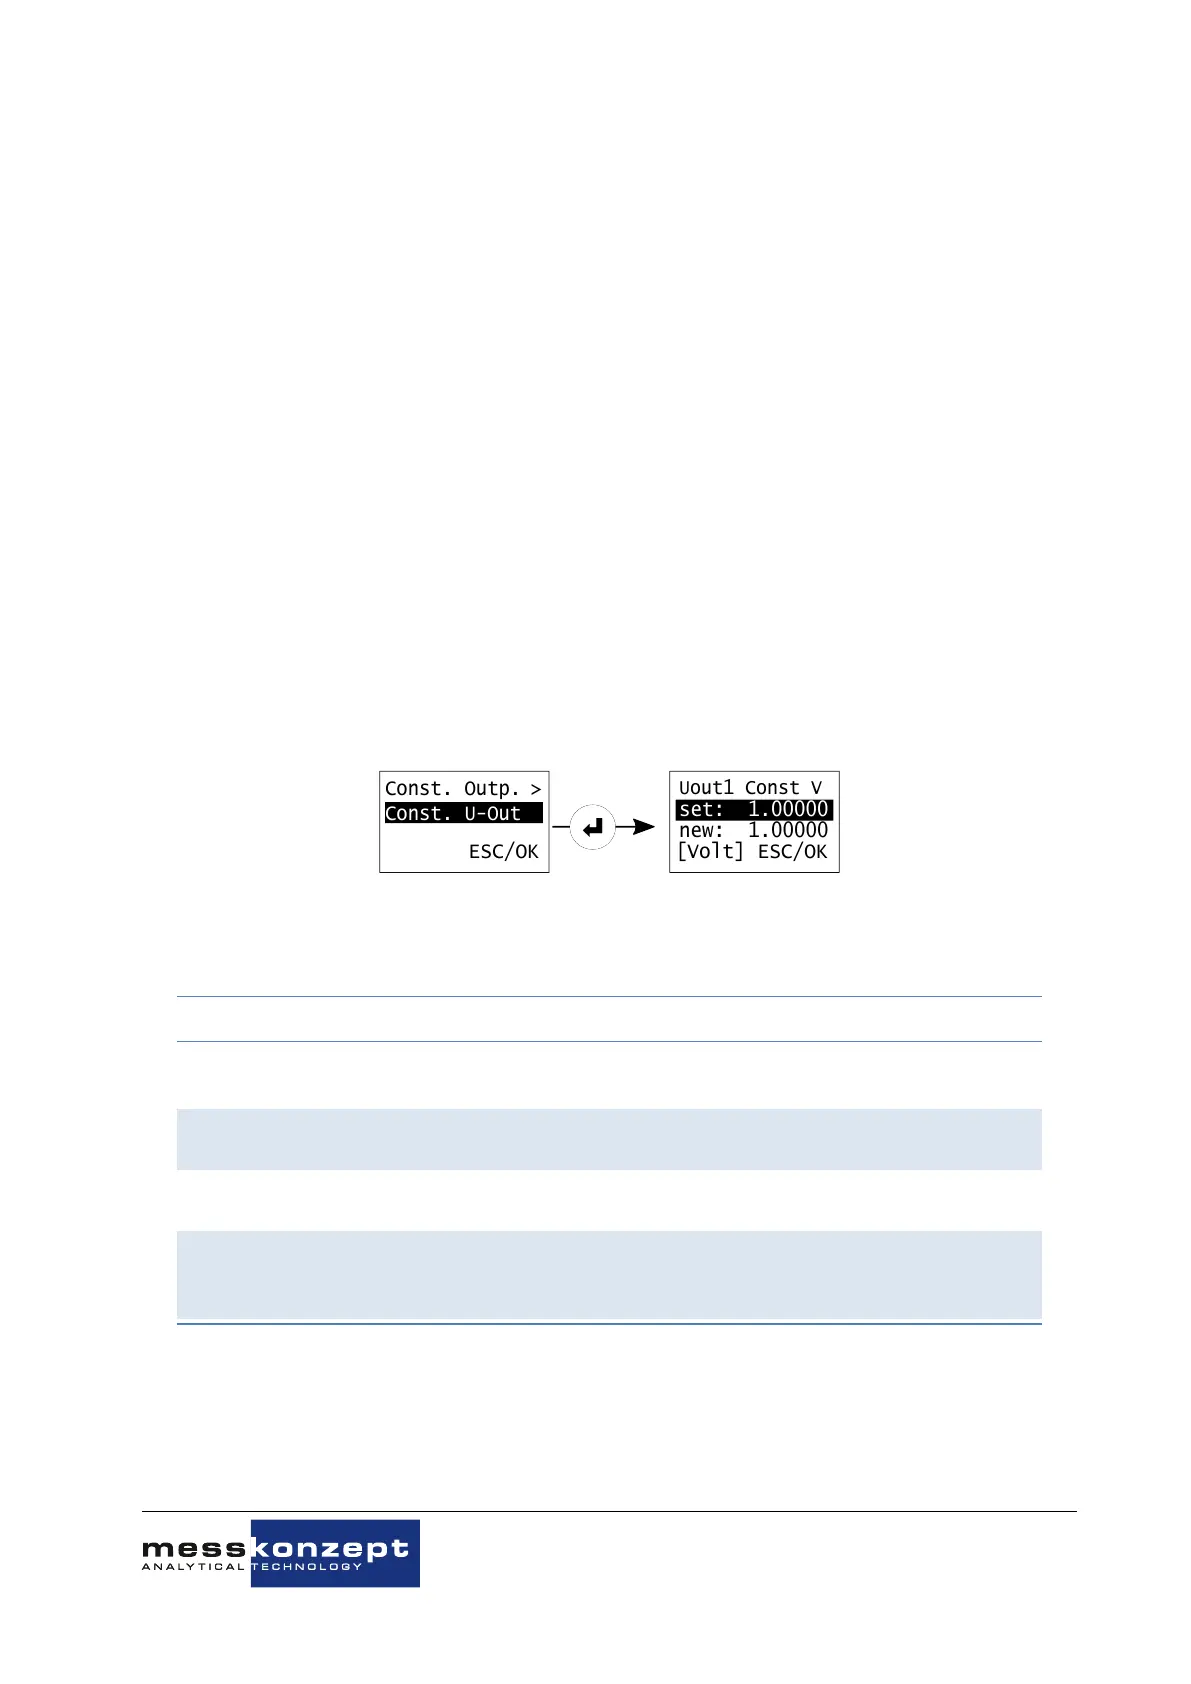
5. Changing the value of the constant output: in case you chose the Const. Outp. mode, you
can manually change the value of the constant voltage output by moving the cursor to the second
display line Const. U-Out, clicking <ENTER>, and entering the desired value followed by clicking
OK (see Figure 6.9).
Const. Outp. >
Const. U-Out
ESC/OK
[Volt] ESC/OK
Uout1 Const V
set: 1.00000
new: 1.00000
Figure 6.9: Setting a constant voltage output.
These settings can be set for each voltage output, Voltage Out 1 or Voltage Out 2, separately.
Output Mode Voltage Range Error Indication
0-10V
Output voltage range: 0-10V. Minimum: 0V.
Maximum: 10.5V.
No error indication.
0-5V
Output voltage range: 0-5V. Minimum: 0V.
Maximum: 5V
No error indication.
2-10 (Err)
Output voltage range: 2-10V. Minimum:
1.9V. Maximum: 10.25V.
Error value: 1.5V.
Const. Outp.
The output voltage is constant, its value
can be changed to be any value between
0-10V.
No error indication.
Table 6.3: The available modes of the voltage outputs.
The minimum and maximum values given in the table indicate the limit values of the transition region.
The analog output is held at these values when the measured variable falls below or rises above the
limit value.
File name:
FTC320 Operating Manual_1.09KD201009MPO5V04.pdf