16
ABOUT THE VSA
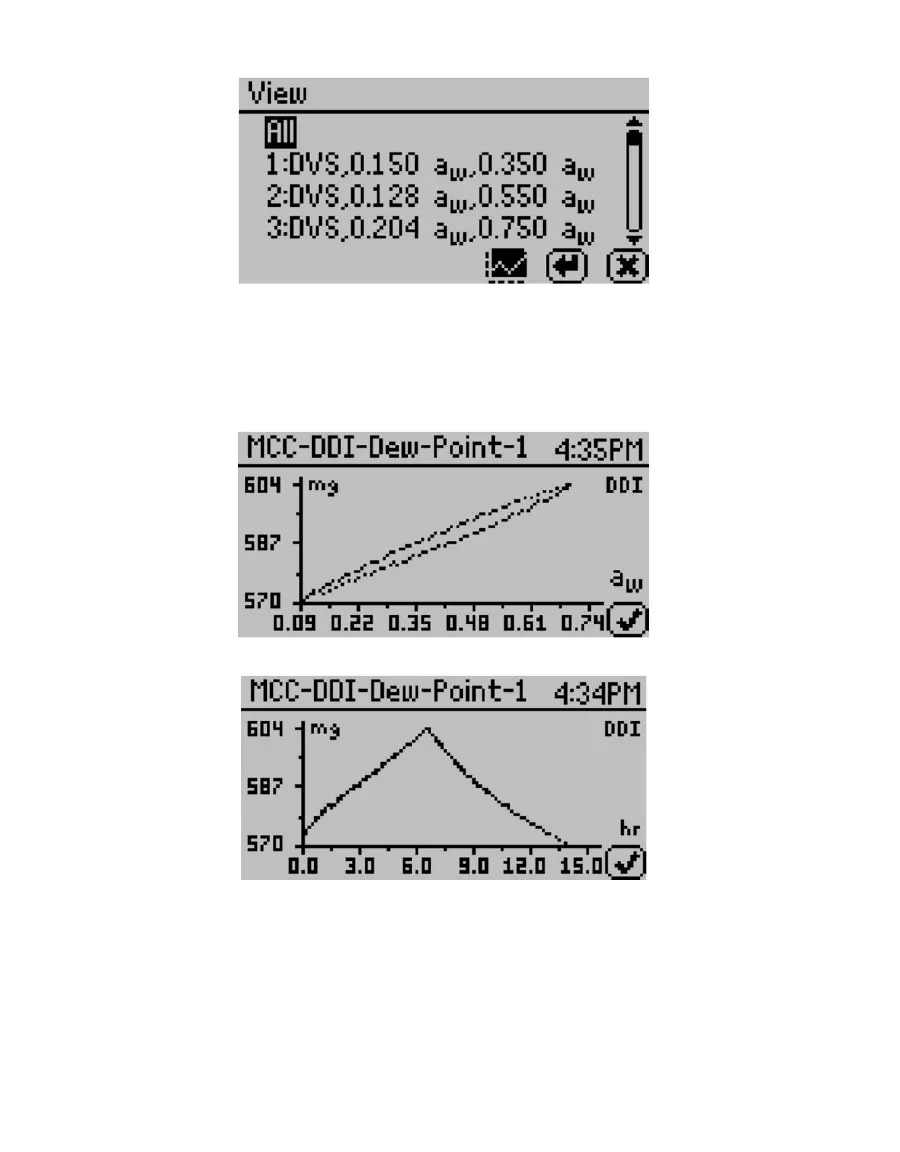
Figure 15 View data screen
GRAPH SCREEN
This selection shows a graph of the selected data from the previous screen. Press the
directional arrows to change the y or x-axis units. The title of this graph indicates the test
name, stage number (if applicable), and the isotherm type is on the right.
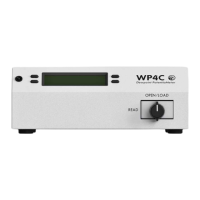
Figure 16 Example of a graph with water activity as the x-axis
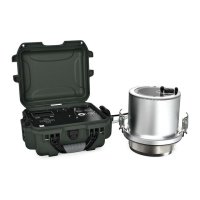
Figure 17 Example of a graph with elapsed time as the x-axis
NOTE: For DVS isotherms, if water activity is the x-axis, only equilibrated data points appear on the chart. To view all
the data points, the x-axis must be in terms of the time elapsed.