14
SYSTEM
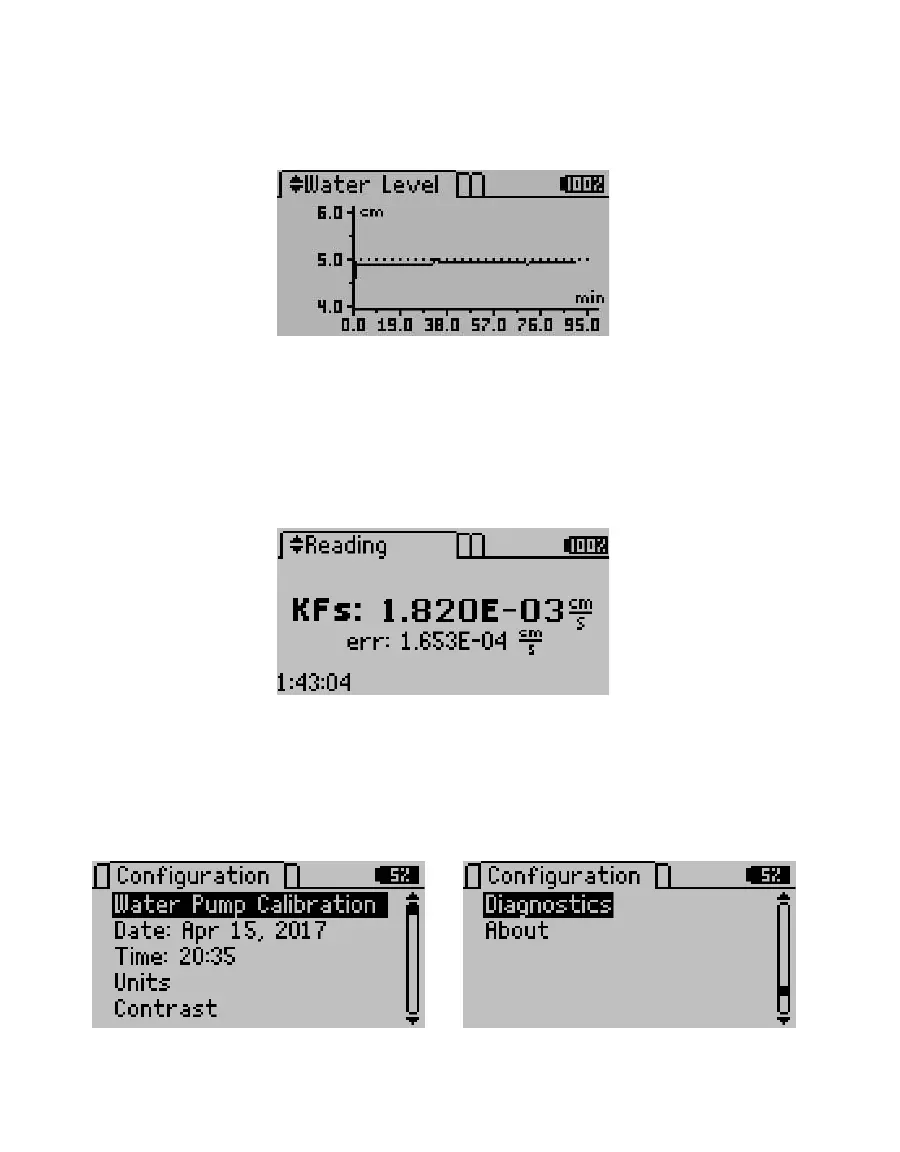
• Water Level Screen. After a test is started, the water level above the soil ramps up to 5 cm.
The Water Level screen displays the current water level on a graph that is updated every
minute (Figure17). The current point is indicated by a flashing dot.
Figure17 Water Level screen
• Results Screen. After a test is complete, the Results screen replaces the Status screen.
It shows the resulting K
fs
of the test (Figure18). The error (err) value also appears on the
Results screen. The err is the standard error of the K
fs
reading and represents the amount
of noise in the measurement. Press UP and DOWN to change Reading screens or press the
POWER/MENU button to navigate to the Configuration tab.
SATURO will display the results from the last test if no test is running.
Figure18 Results screen
CONFIGURATION TAB
The Configuration tab is used to view and set global preferences (Figure19). Press the
POWER/MENU button to navigate to the Configurationtab. Use the UP and DOWN buttons to
scroll through options.
Figure19 Configuration tab
• Water Pump Calibration. Water pump calibration is addressed in Section 4.1.