CUEMIX FX
68
PHASE ANALYSIS
The Phase Analysis window (Figure 9-23 on
page 68) graphs frequency versus phase difference
versus amplitude of a stereo signal on either
rectangular or polar coordinates.
In rectangular coordinates, the vertical axis
represents frequency, and the horizontal axis
represents the phase of the left channel minus the
phase of the right channel (measured in radians).
In polar coordinates, the radius represents
frequency and the angle (theta) from the +y
vertical axis represents the phase difference of left
channel minus the right channel.
Correlation Meter
The blue Correlation Meter to the right of the
display shows the correlation between the two
channels. The higher the meter, the higher the
correlation between the two channels.
Opening the Phase Analysis
Each MOTU audio interface has its own Phase
Analysis window. Choose the Phase Analysis item
from the Devices menu under the desired interface
(Figure 9-6 on page 57).
Choosing a channel to display
The Phase Analysis window follows the currently
chosen Scope channels (Figure 9-1 on page 52).
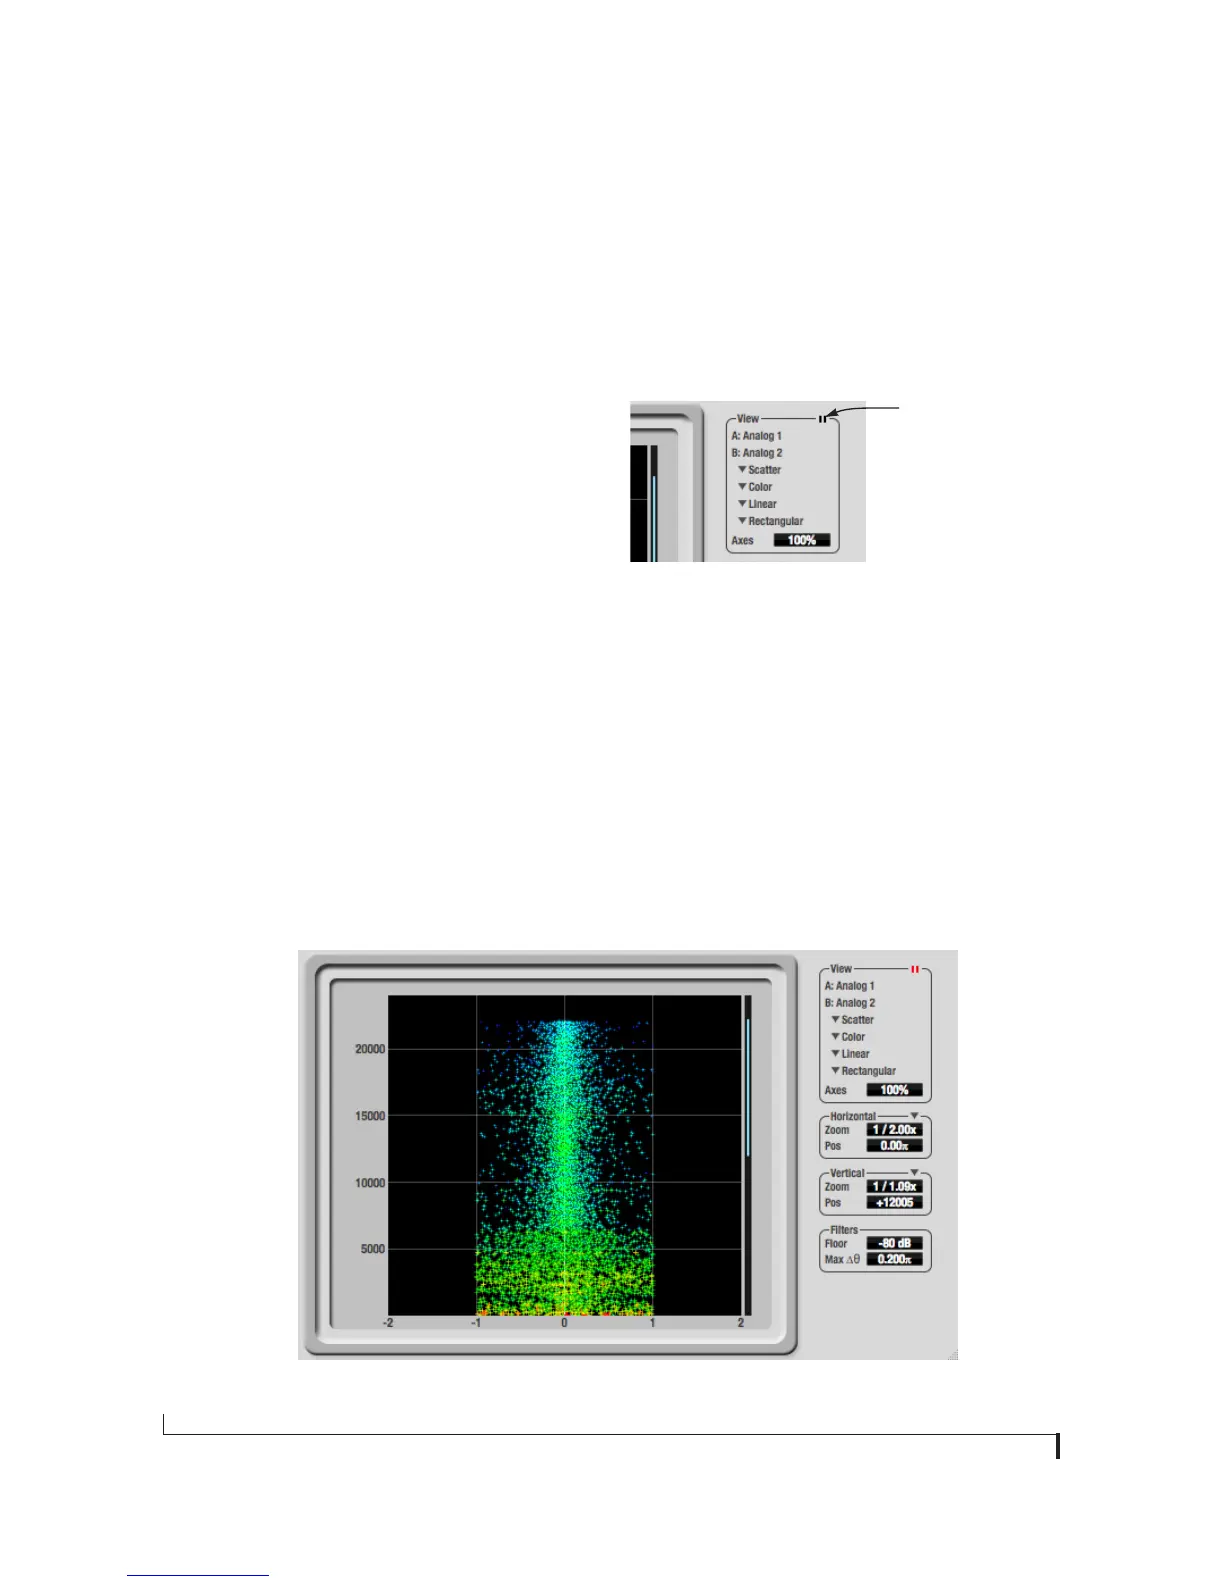
View controls
The View controls (Figure 9-24) provide several
options for the Phase Analysis display.
Figure 9-24: View controls
Pausing the display
The Pause button in the upper right corner of the
View section (Figure 9-24) allows you to freeze the
display at any time. To resume, click the button
again. The correlation meter will remain active
while the display is paused.
A/B (stereo audio channels)
The View section (Figure 9-24) displays the pair of
input or output audio channels you are viewing.
See “Choosing a channel to display” above.
Figure 9-23: Phase Analysis
Pause button