Section-10
www.newavenergy.com
04-1206_S10_NW_TDSPS_10-50kVA_GB_110201.DOC Page 6/19
Printed in Switzerland – Modifications reserved
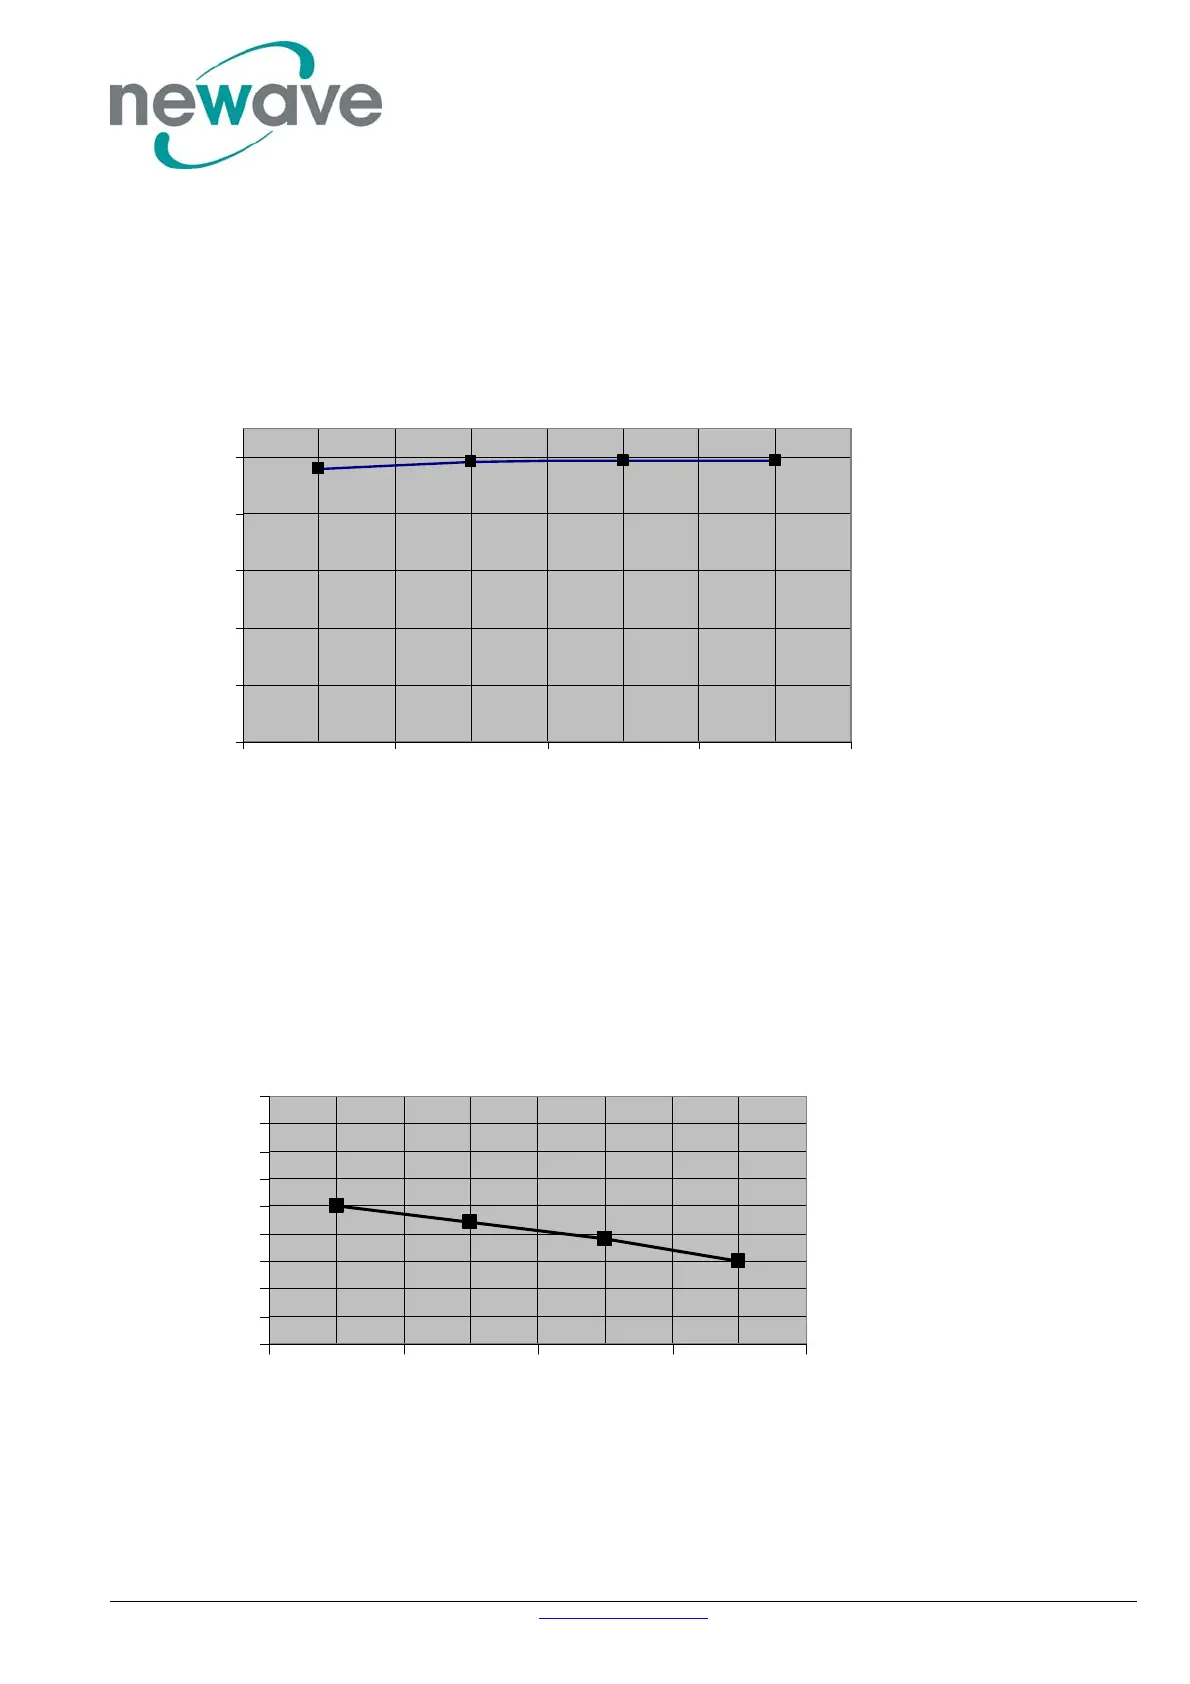
10.3.1 GRAPH: INPUT PF VERSUS % LOAD
Input Power factor (Leading)
0.96
0.985
0.99
0.99
0
0.2
0.4
0.6
0.8
1
25 50 75 100
Load %
Input Power Factor
10.3.2 GRAPH: INPUT DISTORTION THDi VERSUS % LOAD
Input Current Distortion THDi
3.0
4.0
3.4
3.7
1.5
2
2.5
3
3.5
4
4.5
5
5.5
6
25 50 75 100
Load %
Input THDi %
NOTE: Depending on power ratings