NOVUS AUTOMATION www.fieldlogger.net 51/104
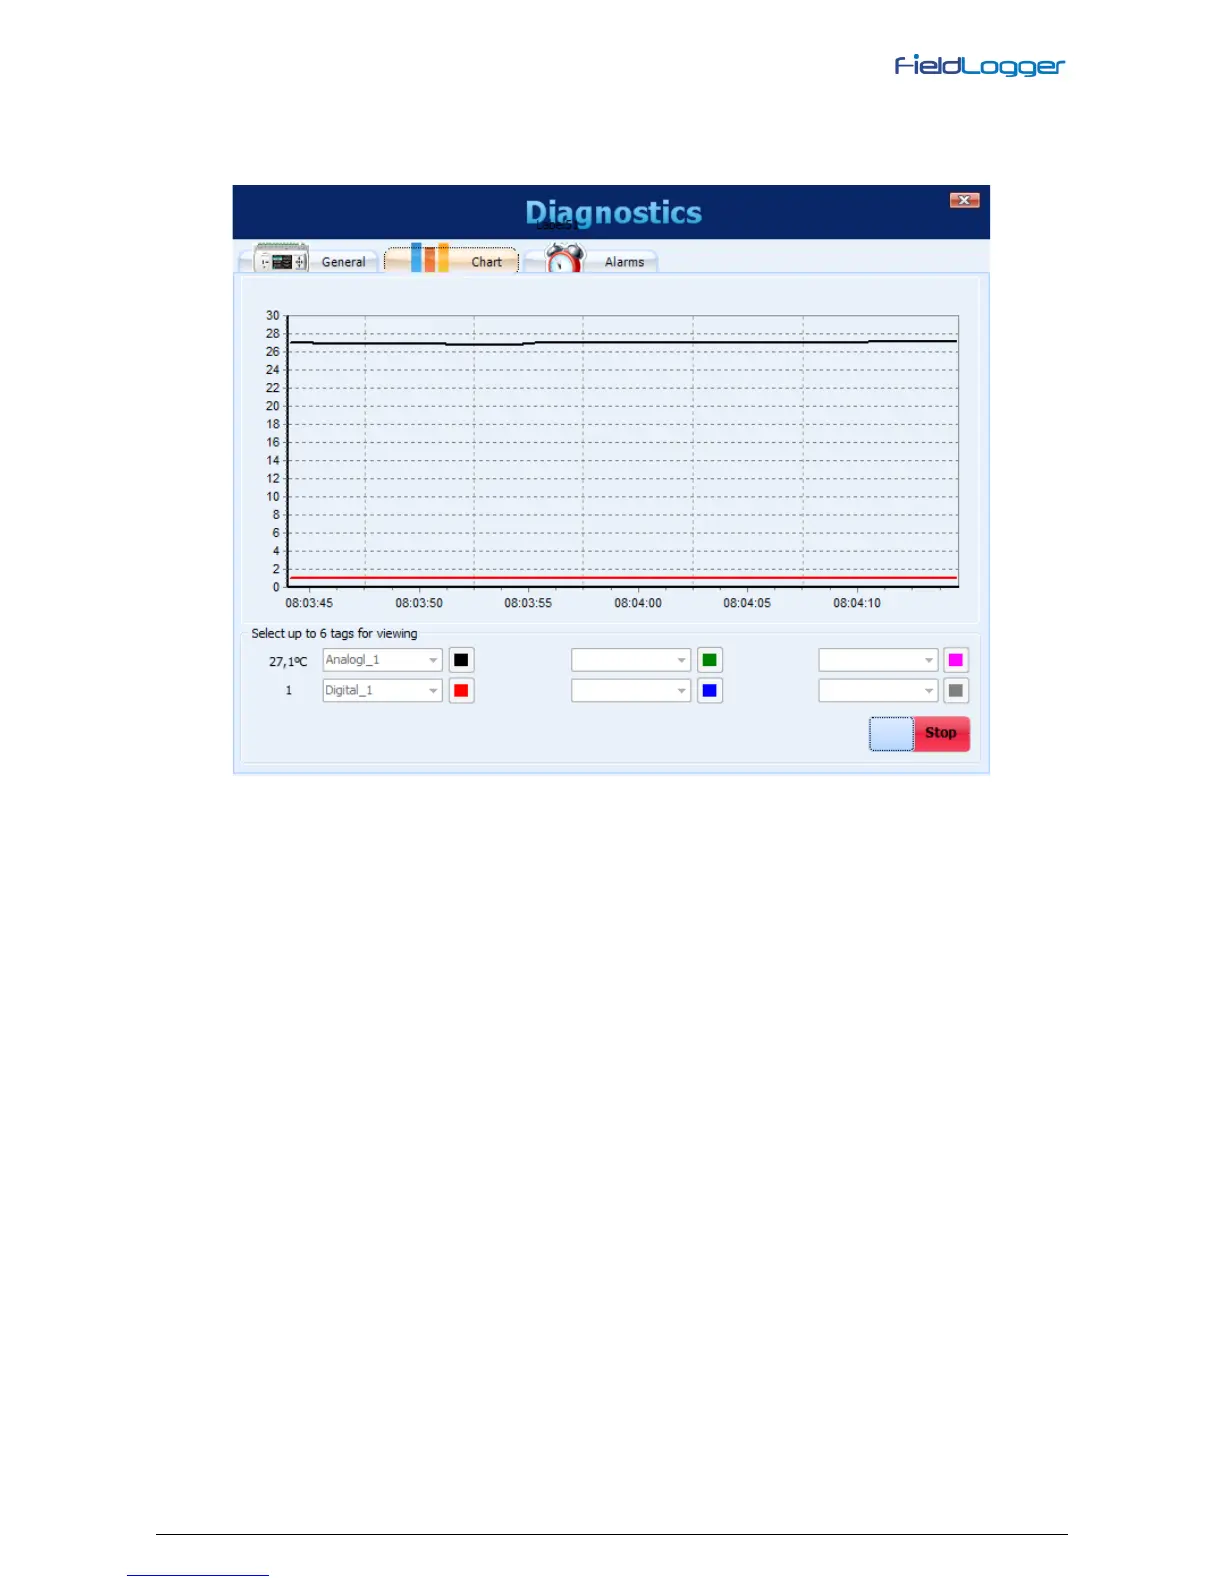
Selecting the Chart tab, you can select up to 6 channels to be viewed in a chart. At the bottom, you can select the
channel to be displayed and its associated color on the chart. When all desired channels are selected, you must click on
the "Start" button and the channel values will be read every 2 seconds (approximately) and will be plotted on the chart. If
any channel is in error, the channel selection will be shown in red.
Diagnostics - Monitoring channels