20
DIVE MODE BAR GRAPHS
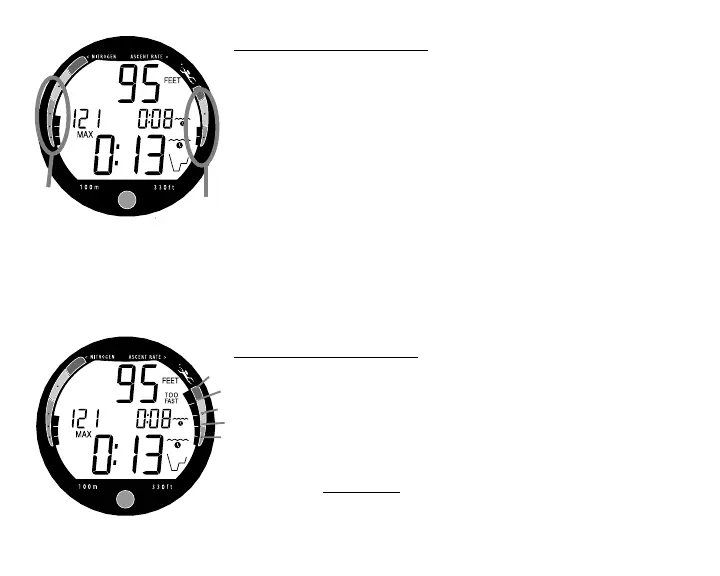
As your depth and elapsed dive time increase, the Tissue
Loading Bar Graph (TLBG) will fill with segments (green
toward red) to represent the absorption of nitrogen (Fig.
15a). While ascending to shallower depths, the segments
that have filled the TLBG will begin to recede, offering a
graphic representation of your multilevel diving capability.
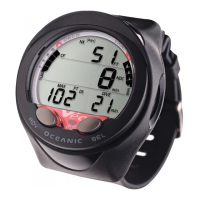
The Variable Ascent Rate Indicator (VARI) shows how
fast you are ascending (Fig. 15b). When you exceed an as-
cent rate of 60 fpm (18 mpm) if deeper than 60 feet (18m),
or 30 fpm (9 mpm) if shallower than 60 feet (18m), it will en-
ter the red (Too Fast) zone and all segments plus the graphic
TOO FAST will flash (Fig. 16) until your ascent rate is
slowed.
CONTROL OF DISPLAYS
During dive modes, 3 displays of information are available.
The diver can change from one display to another as often as
desired by pressing and releasing the Button.
During No Decompression conditions, the diver can choose
how much information is displayed at a given time. The dis-
play chosen will remain until the diver presses the Button to
change it.
Fig. 16 - Ascent Too Fast
Fig. 15 -Bar Graphs
a
b