34
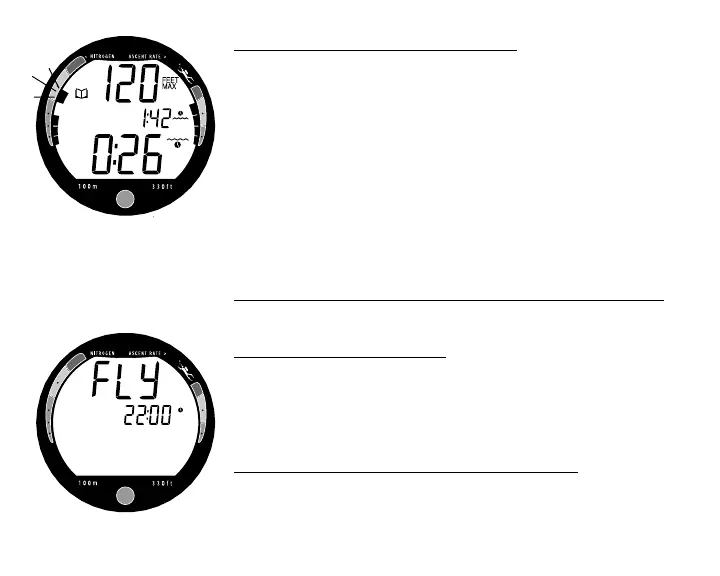
Dive Data (the second screen) includes (Fig. 36) -
• Log Mode icon
• Maximum Depth - reached during the dive (and icon)
• Surface Interval - prior to that dive (and icon)
• Elapsed Dive Time (and icon)
• Variable Ascent Rate Indicator - showing the maximum
ascent rate maintained for 4 consecutive seconds during
the dive.
• Tissue Loading Bar Graph - showing tissue nitrogen load-
ing at the time you surfaced at the end of the dive. Also,
the segment that reflects the maximum loading during the
dive will appear flashing.
To access the first screen of the previous dive's Log
• Press the Button momentarily.
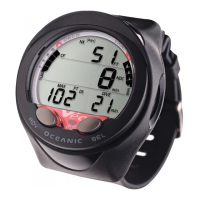
AFTER THE FIRST 2 HOURS
Two hours after the last dive the Surface Sequence will no
longer be displayed. The Time to Fly countdown (Fig. 37)
will be displayed continuously until it counts down to 0:00
(hr:min) or another dive is made.
To access other modes or enter settings -
• Press the Button to reactivate the Surface Sequence.
• The unit will again revert to the Time to Fly countdown af-
ter 2 hours, if the Button is not pressed.
Fig. 36 - Log Dive Data
Fig. 37 - Time to Fly Countdown