__________
CHAPTER
3
PROGRAMMING
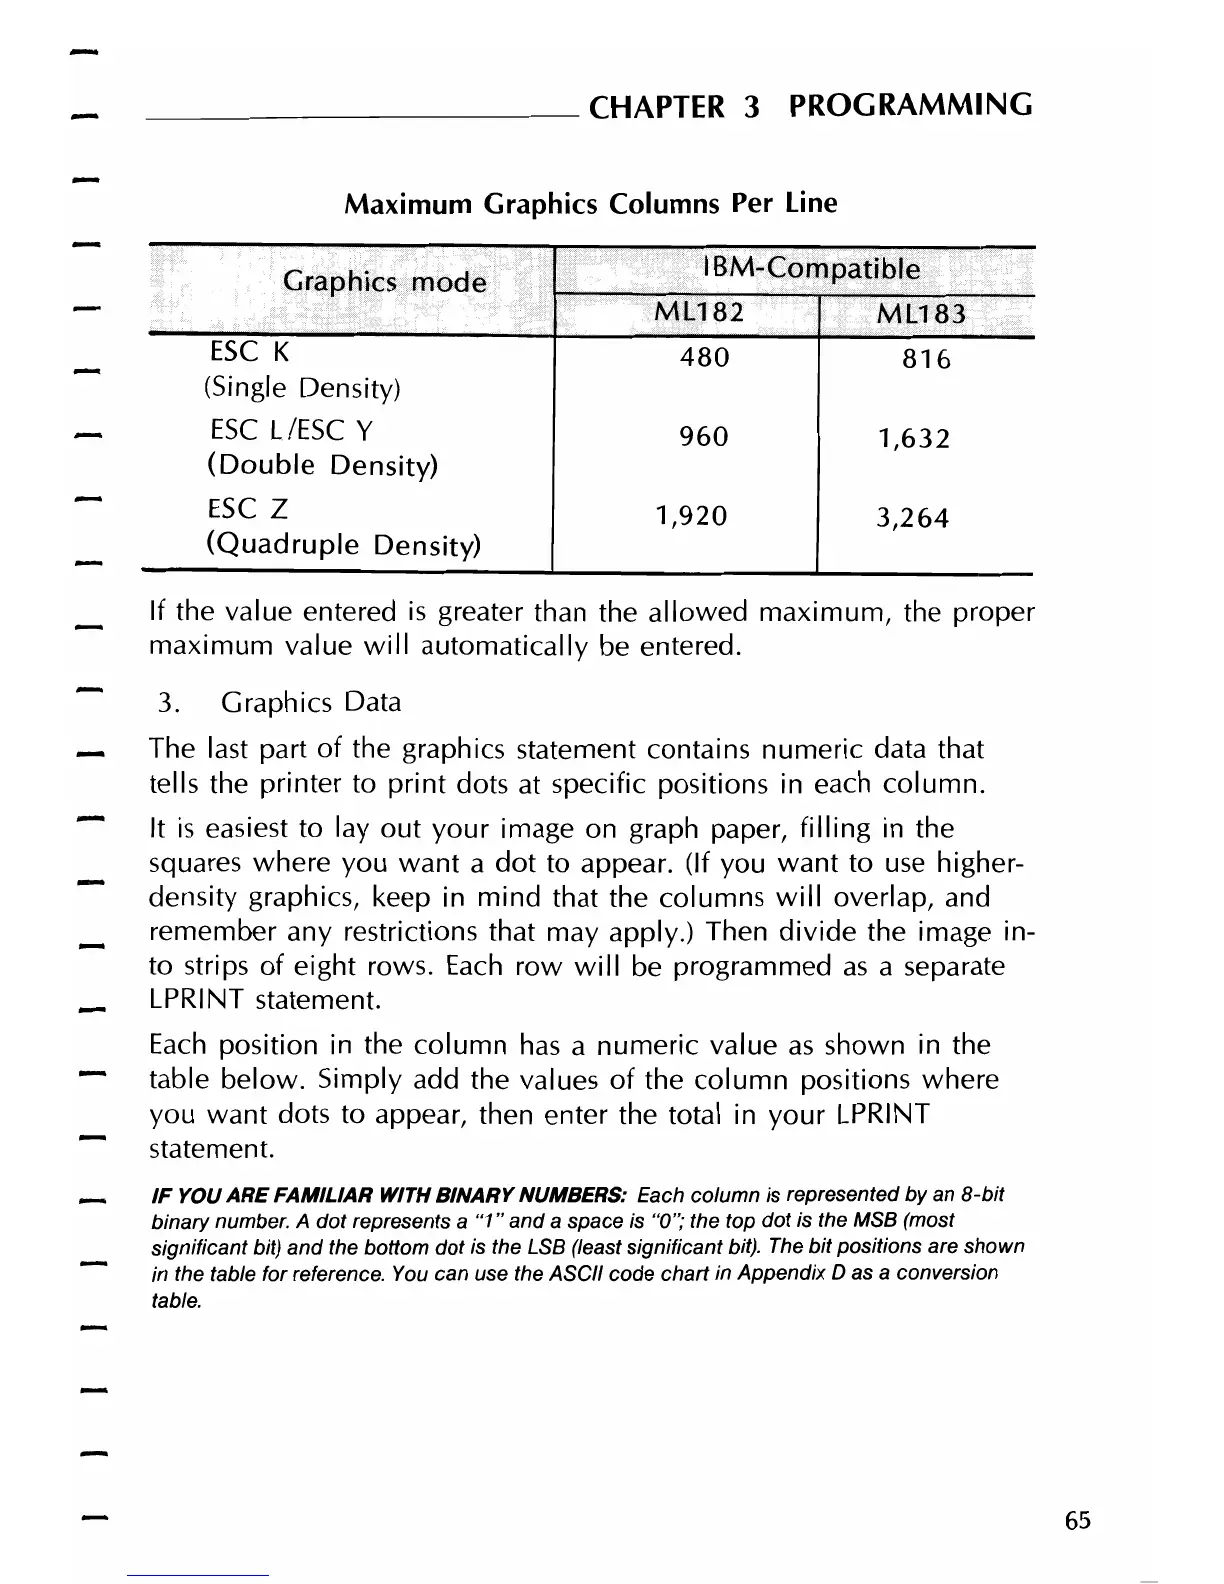
Maximum Graphics Columns Per
Line
<:;raphi~s
mo~e
ESC
K
(Single Density)
480
816
ESC
LIESe y
(Double
Density)
960
1,632
ESC
Z
(Quadruple
Density)
1,920
3,264
If the value entered
is
greater than the allowed maximum, the proper
maximum
value
will
automatically be entered.
3.
Graph ics Data
The last part
of
the graphics statement contains numeric data that
tells the printer
to
print
dots at specific positions in each column.
It
is
easiest
to
layout
your
image on graph paper,
filling
in the
squares where you
want
a
dot
to
appear. (If you
want
to
use
higher-
density graphics, keep in
mind
that the columns
will
overlap, and
remember any restrictions that may apply.) Then
divide
the image in-
to strips
of
eight rows.
Each
row
will
be programmed
as
a separate
LPRINT statement.
Each
position in the
column
has
a numeric value
as
shown in the
table below. Simply add the values
of
the
column
positions where
you
want
dots to appear, then enter the total in
your
LPRINT
statement.
IF
YOU
ARE
FAMILIAR
WITH
BINARY
NUMBERS: Each column is represented by an
8-bit
binary number. A dot represents a "1"
and
a space
is
"0"; the top dot is the MSB (most
Significant bit)
and
the bottom
dot
is the LSB (least significant bit). The
bit
positions are shown
in the table for reference. You can use the ASCII code chart in Appendix 0
as
a conversion
table.
65