__________
CHAPTER
3
PROGRAMMING
Putting it Together
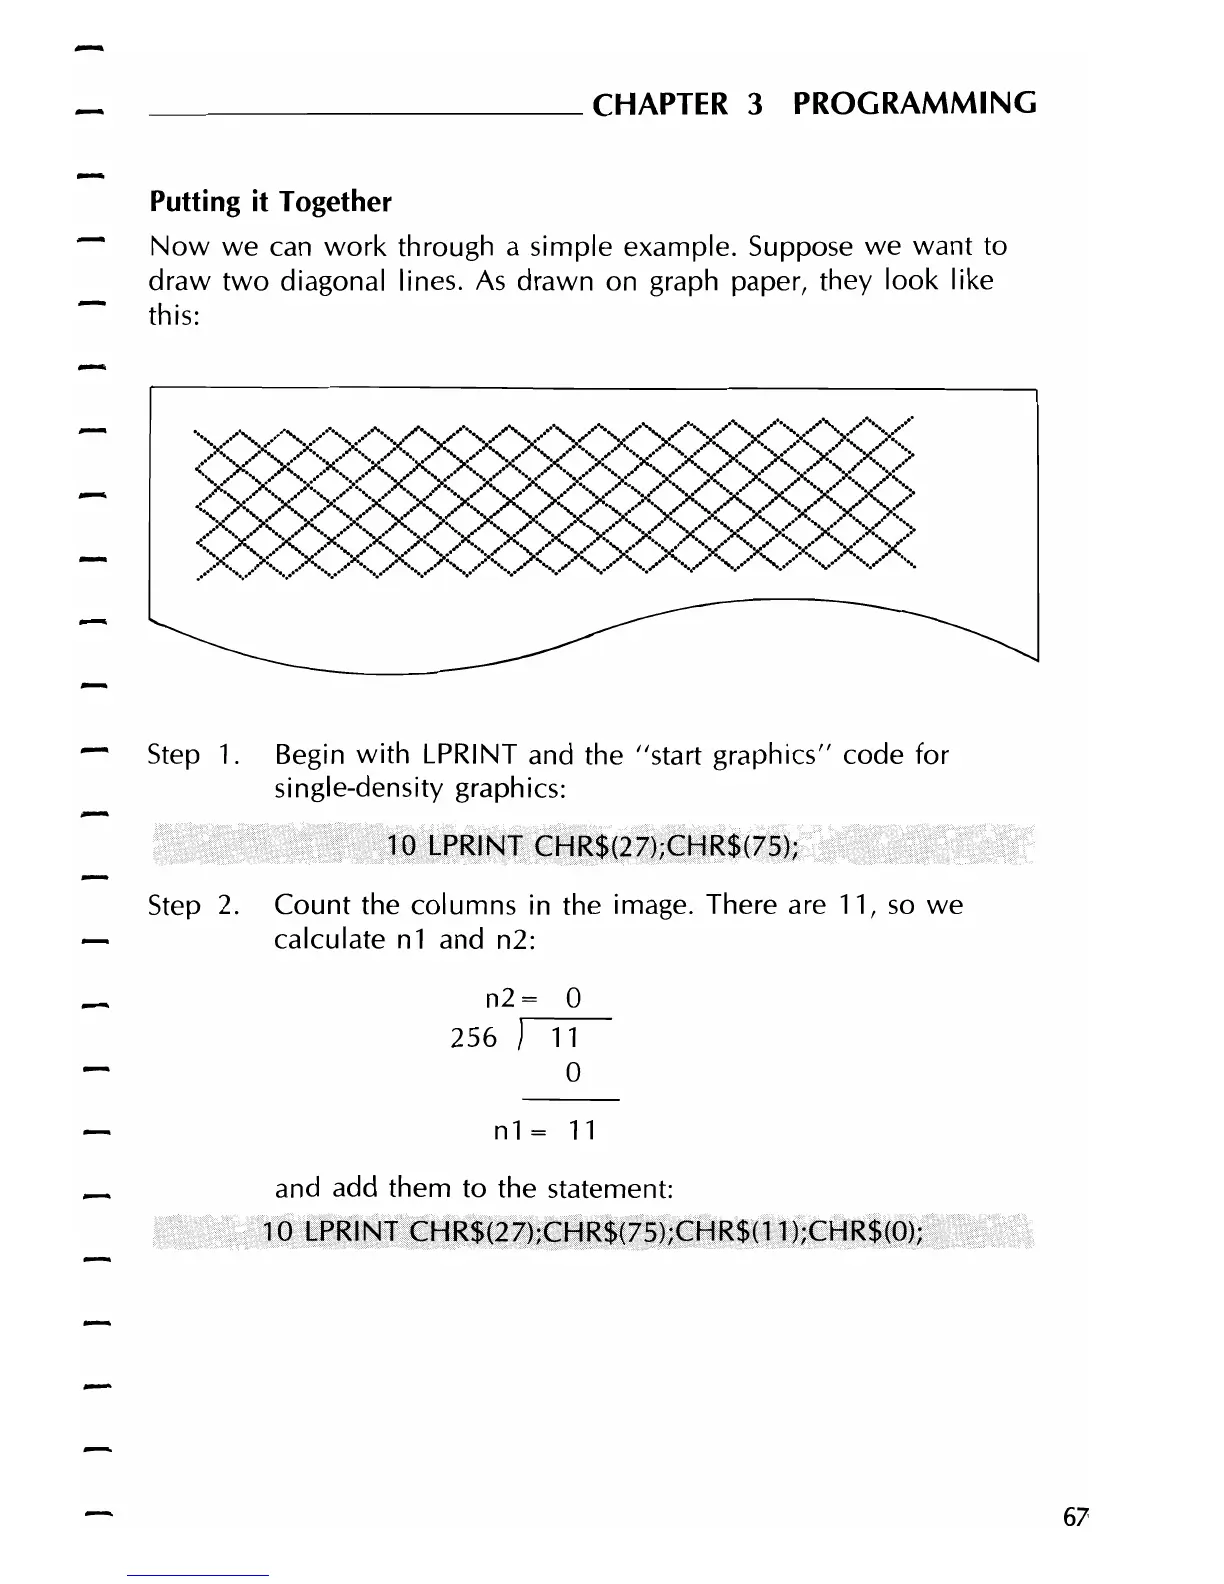
Now
we can
work
through a simple example. Suppose
we
want
to
draw
two
diagonal lines.
As
drawn on graph paper, they
look
like
this:
Step
1.
Begin
with
LPRINT and the "start graphics" code
for
si
ngle-density graph ics:
r;;!;;j;~~\~iJ
0 LPR1;,T
Cltlg$(27);CHR$(75);i.f~ii;i;\
Step 2.
Count
the columns in the image. There are 11,
so
we
calculate
n1
and n2:
n2=
0
256 )
11
o
n1 =
11
and add them to the statement:
···!rOrp~iNT
•..
~HR$it~i.~HR$(~i~~iltlR$(.l!lj:·t:ii9I~$(O~rf
tj!}F".*
67