10.11.1 Analysis window
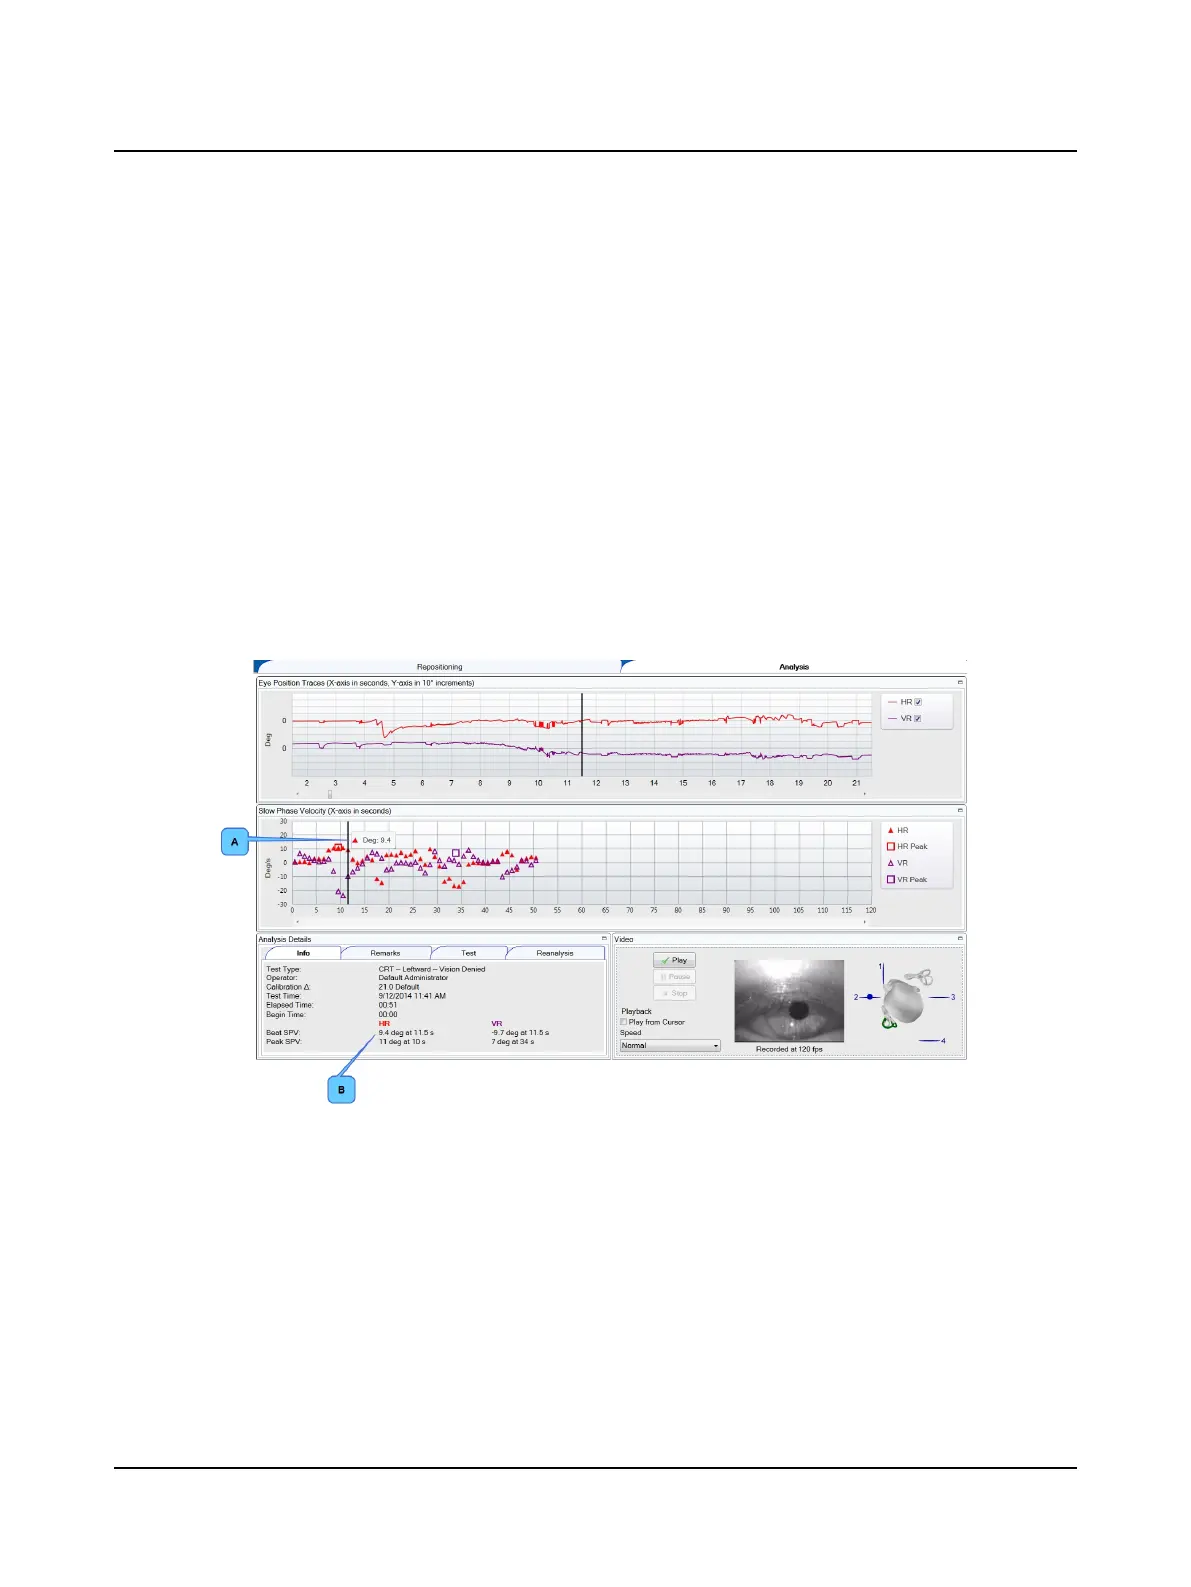
Eye Position Traces
Horizontal (HR) and vertical (VR) eye position traces display in the Eye Position Traces window. You can choose to display
or not display a trace by clicking the check box in the trace legend.(The default display is set in Test Options.)
The traces are displayed with the culmination phase (area with the most robust response) centered in the middle of the
window. To view an entire trace use the scroll bar below the trace. The report prints the part of the trace seen in the
Traces window centered around the cursor.
To choose when analysis begins, refer to Reanalysis ► 95.
Slow Phase Velocity graph
The purpose of this graph is to provide a record of the strength of the nystagmus. This graph displays the individual nys-
tagmus beats identified by the SPV algorithm for the horizontal right (HR) and vertical right (VR) traces. The SPV peak is
indicated in the graph by a square.
To select a particular beat click on it or use the left/right arrow keys to move between beats. The SPV value for the beat is
displayed whenever the mouse is positioned over the beat (A) and in the Info window (B).
For more information, refer to the Reference Manual appendix that describes how the SPV peak is determined.
If the algorithm did not pick a peak, manually set the peak for that trace. Refer to Reanalysis ► 95.
Otometrics - ICS Impulse USB
93
10 Positional