Please note:
When the pulse outputs are connected to
–
OTT dataloggers ➝ no additional wiring is required to be made. You may
directly connect the pulse outputs to the pulse inputs of an OTT datalogger.
– Third-party datalogger ➝ external wiring at the pulse and status outputs must
be designed in such a way, that the limits for I
max
≤ 120 mA and U
max
≤ 28 V
will be kept in all operating conditions! Use a pull-up resistor as applicable!
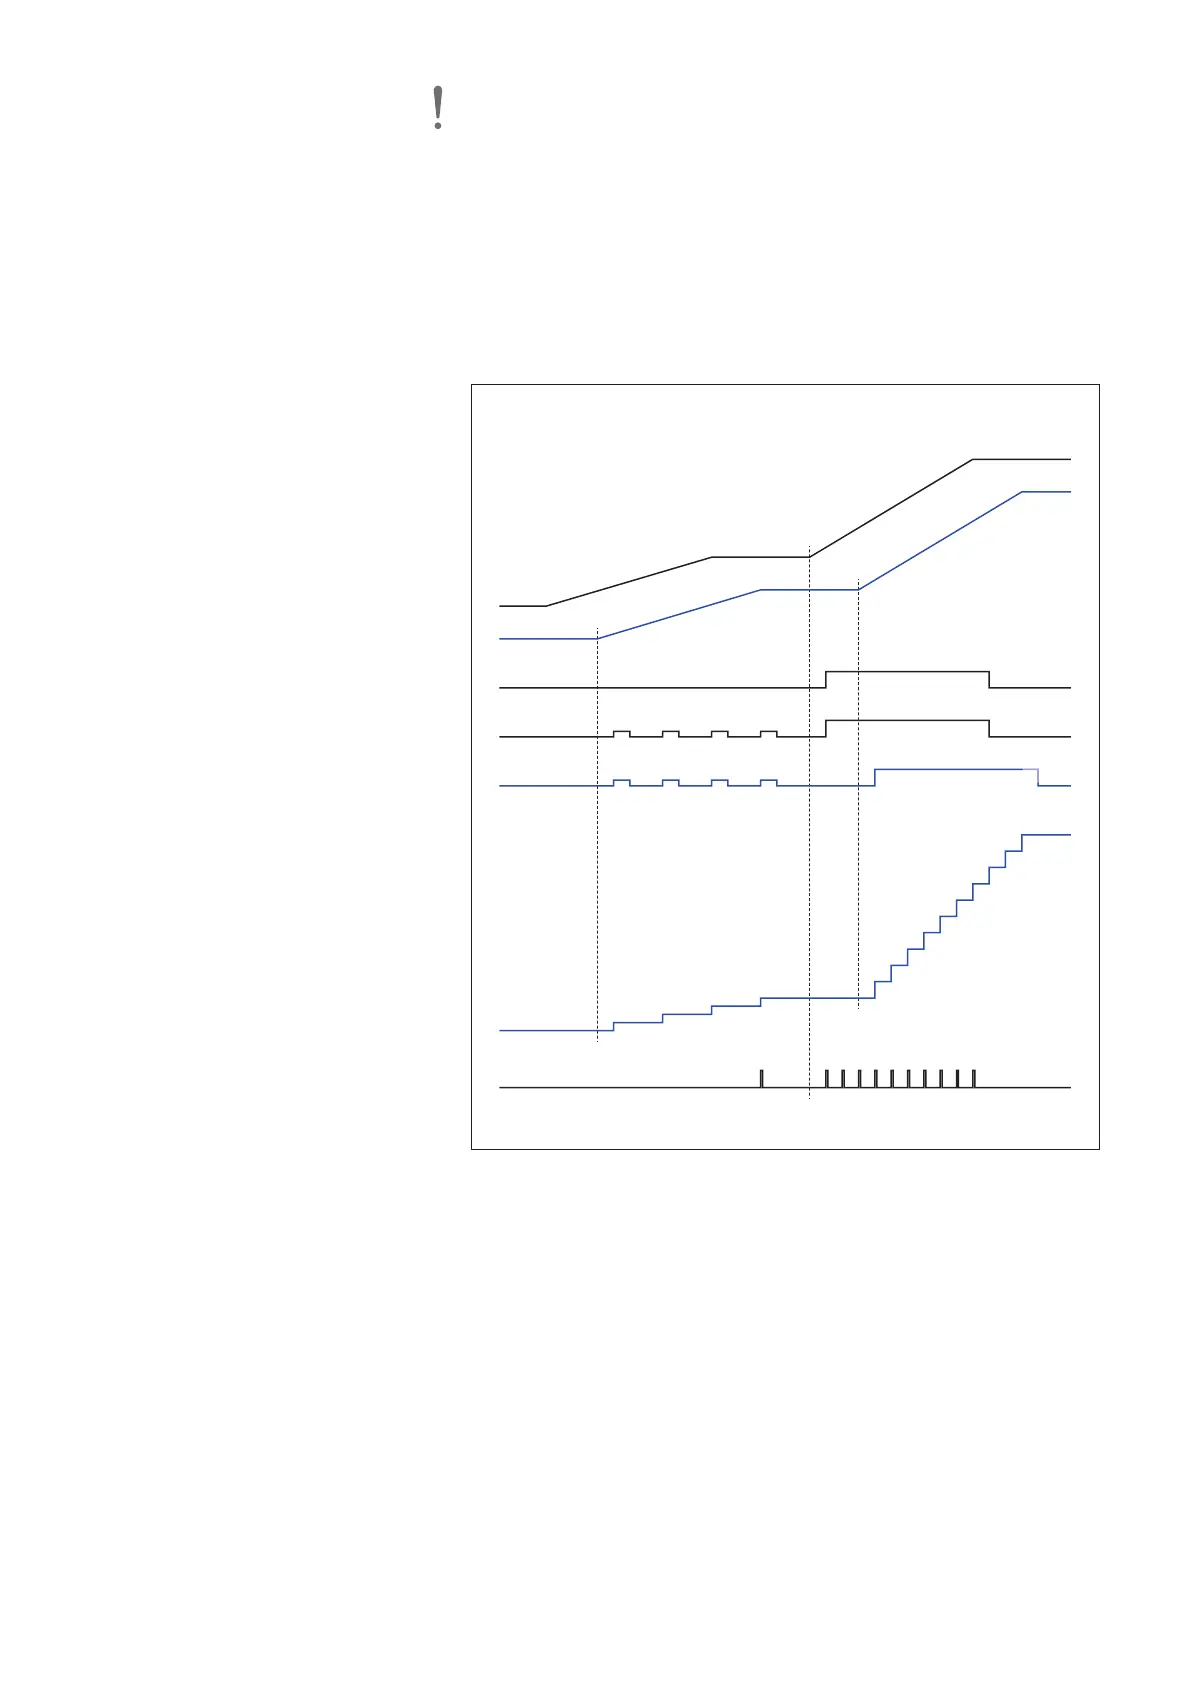
3.3 Graphic display of measured value output for different
precipitation intensities
Fig. 3: Schematic display of measured
value output for different precipitation
values of the OTT Pluvio
2
S for fine
precipitation (< 0.1 mm/min) and
precipiation (≥ 0.1 mm/min).
Thresholds of the channels
are indicated on the right.
Bucket RT
Bucket NRT
Intensity RT
Accu RT-NRT
Accu NRT
Accu total NRT
Fine precipitation
< 0,1 mm/min
Precipitation
≥
0,1 mm/min
Pulse-Accu RT-NRT
5
min
Threshold
0,001 mm
0
,001 mm
0,1 mm/min
0,03 mm
1)
0
,03 mm
1)
0,1 mm
2)
1)
within one hour
2)
adjustable
0,03 mm
1)
11