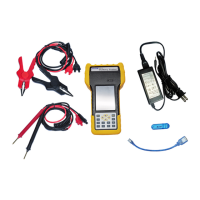
Fig 4.2.2.1.d
Move the cursor on each column of the histogram; you will see relative testing result (cell number, time,
resistance, voltage and capacity) of each cell on the top.
Click OK to close the window.
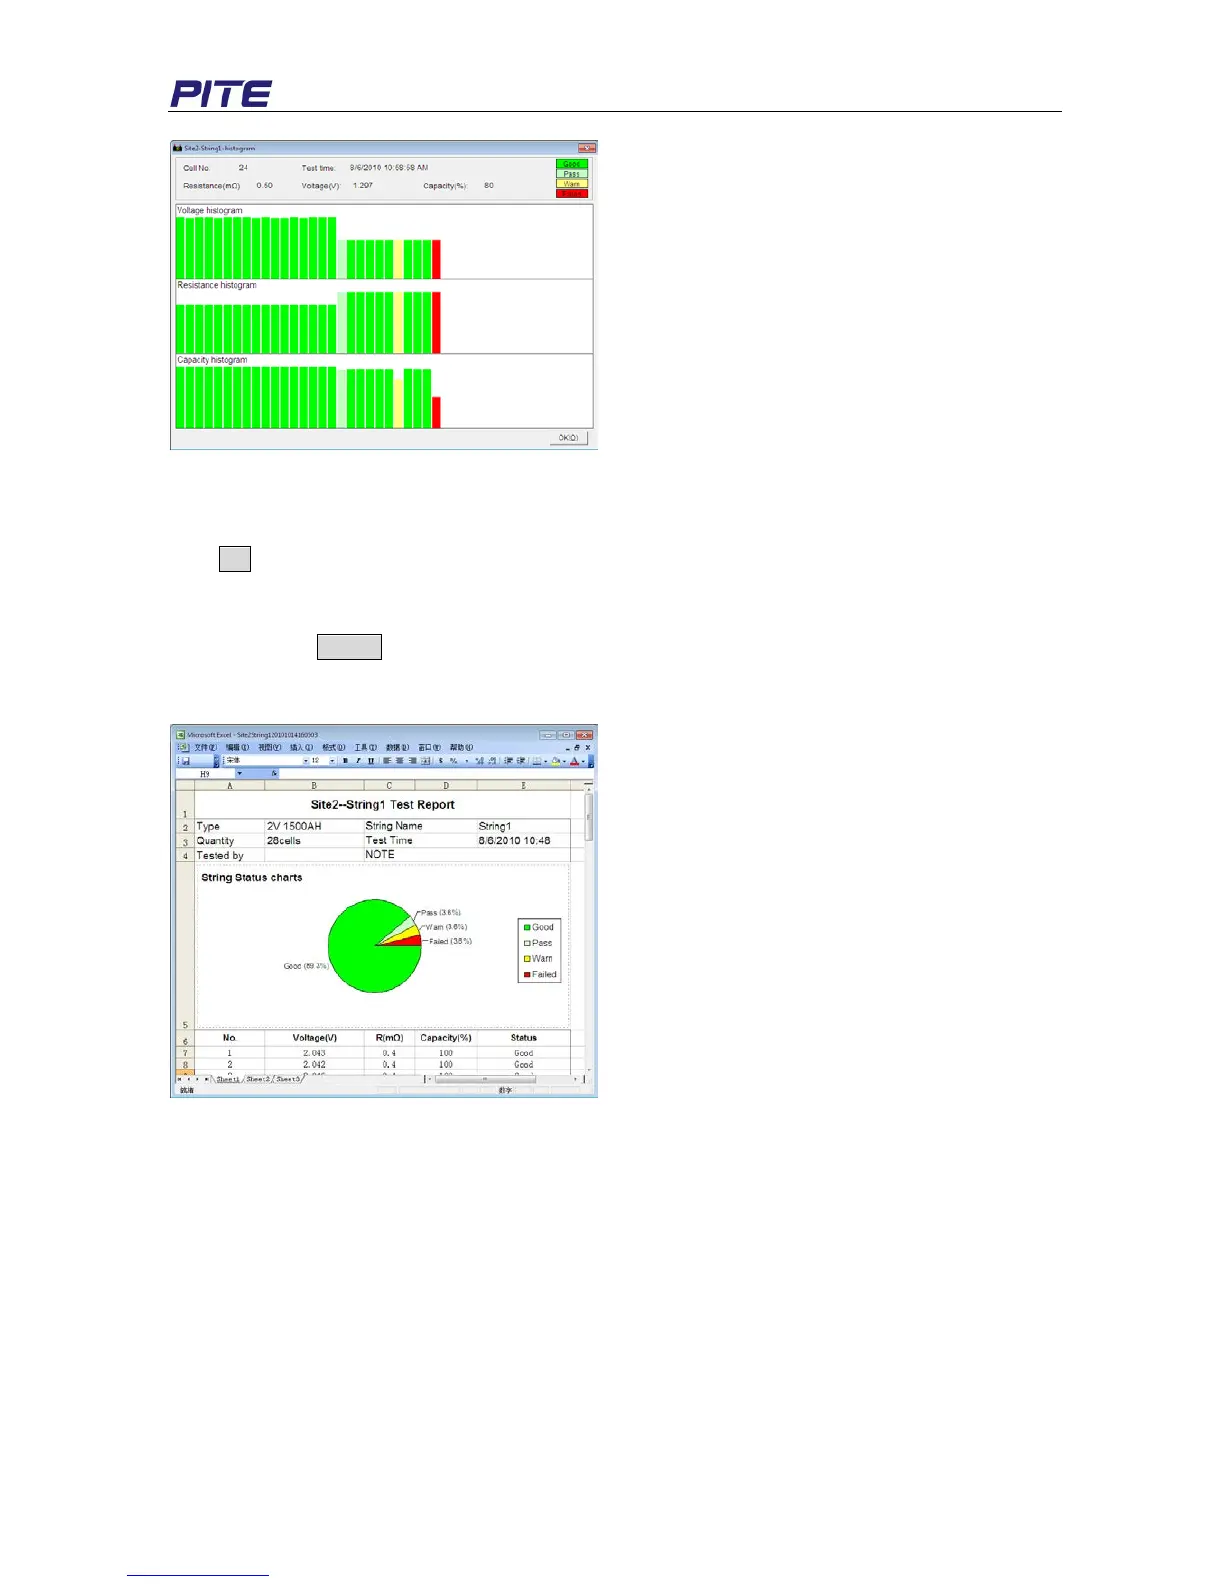
3) Export Data
Click the button Export (in Fig 4.2.2.1.a) and the selected data will be generated as a report in the
format of Microsoft Excel like Fig 4.2.2.1.e. This report will be automatically saved in your computer. To
find out where it is, click “File” and then “Open Report List” in the toolbar of main screen.
Fig 4.2.2.1.e
You could edit the report if necessary. If your PC is well connected with printer, you can print it directly.
NOTE: Please install Microsoft Excel2000 above version before you export the data.
4) Delete Data
Select the test time, right click and select “Delete” to erase the record.
For multi-selection, you could use keys of Ctrl or Shift.
4.2.2.2 View Cell Data
1) View Data
Double click the item “Cell” under each site in main screen, cell test data will be exemplified as below: