Step 4.2: Check reflection diagrams
The reflection diagram of the radar can be accessed via the sensor configuration page by
clicking on the corresponding "reflection" button (Fig. 3.7).
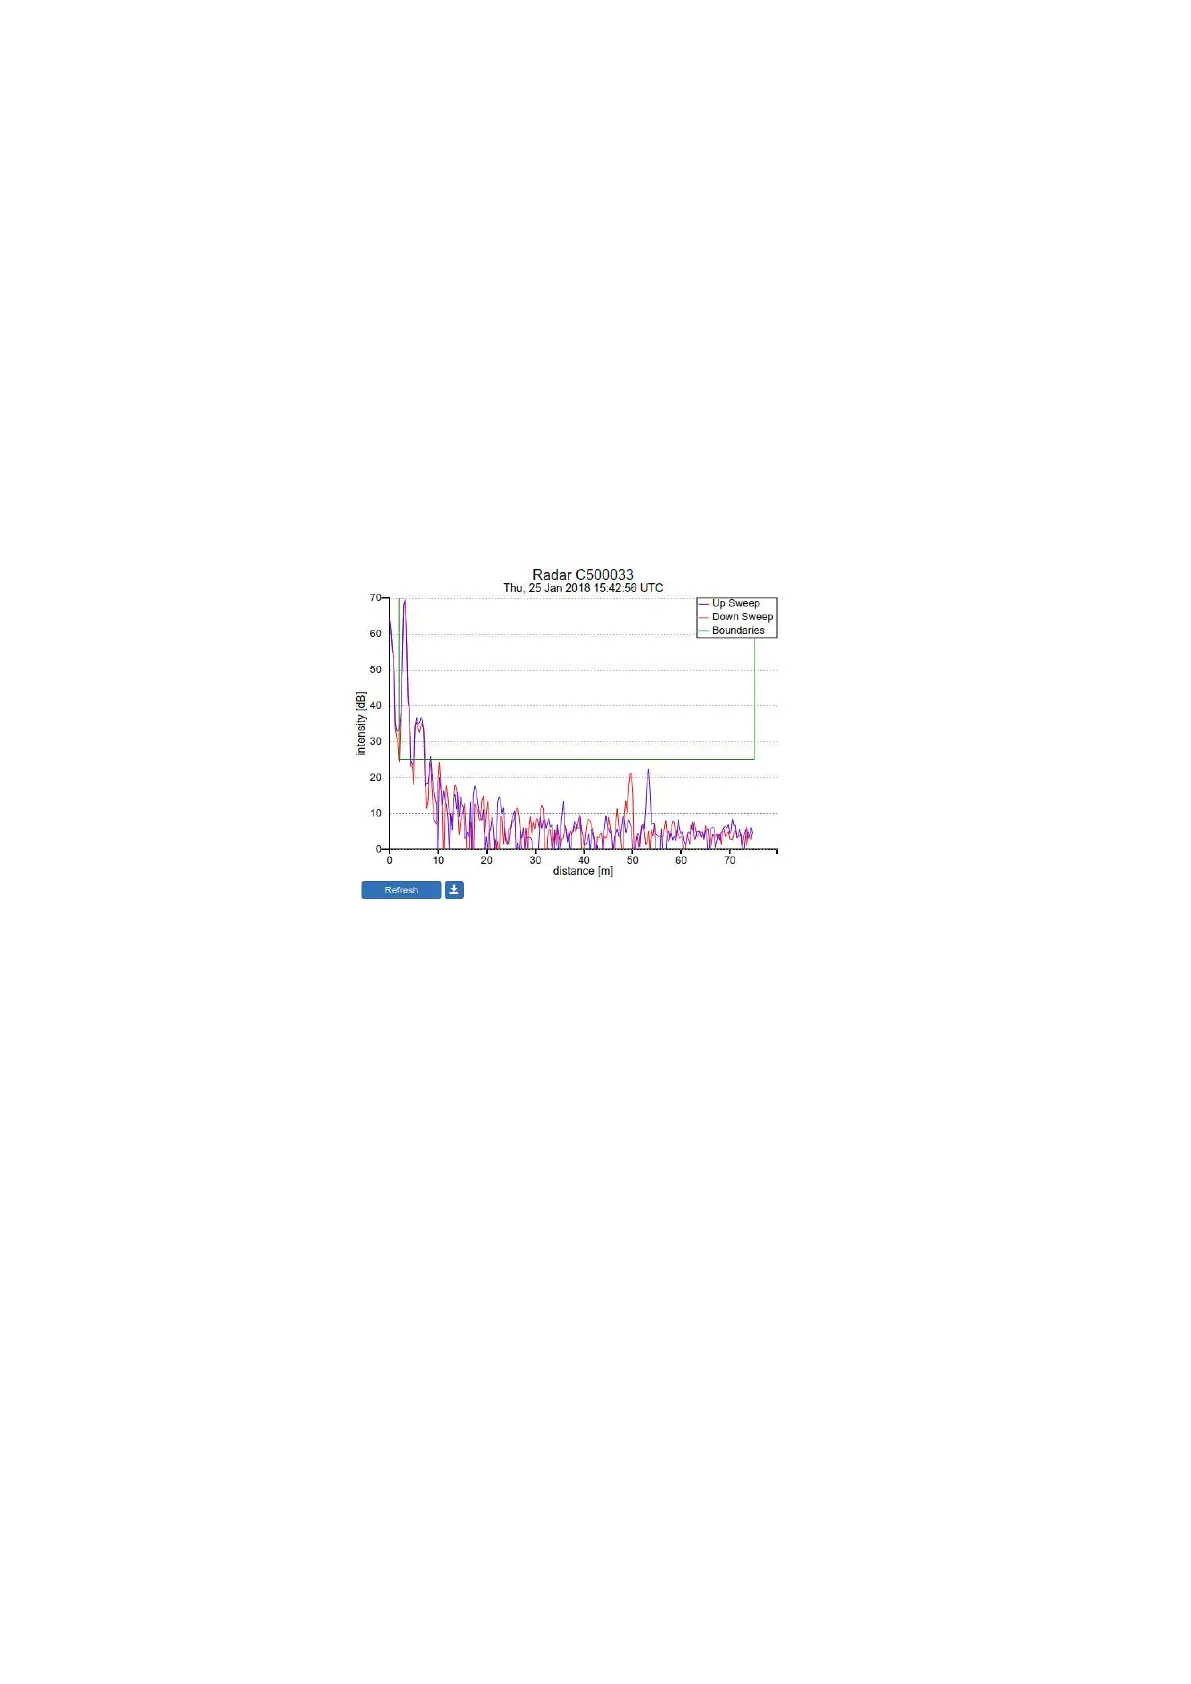
A reflection diagram is a graphic representation of a single measurement, where the signal
strength [dB] is plotted against the measurement distance [m]. A measurement consists of
one up-sweep (increasing frequency, blue curve) and one down-sweep (decreasing frequency,
red curve).
In some cases several peaks are visible in a reflection diagram as shown in Fig. 3.7. This
is called a double reflection and is caused by the radar signal b ouncing back and reflecting
from the water surface for a second time. The signal processing takes this phenomenon into
account such that it does not have a negative effect on the measurements.
Figure 3.6: The reflection diagram gives a graphical representation of the radar signal received in a single
measurement.
Based on the defined range maximum and minimum values, the WaveGuide system shows
the applied boundaries using vertical green lines. A horizontal green line shows the min-
imum accepted reflection strength (the value set as the Signal Minimum [dB] parameter).
The three green lines together form a region in which a measurement is accepted, and any
result outside of it is ignored.
22