Step 4.3: Check measurements
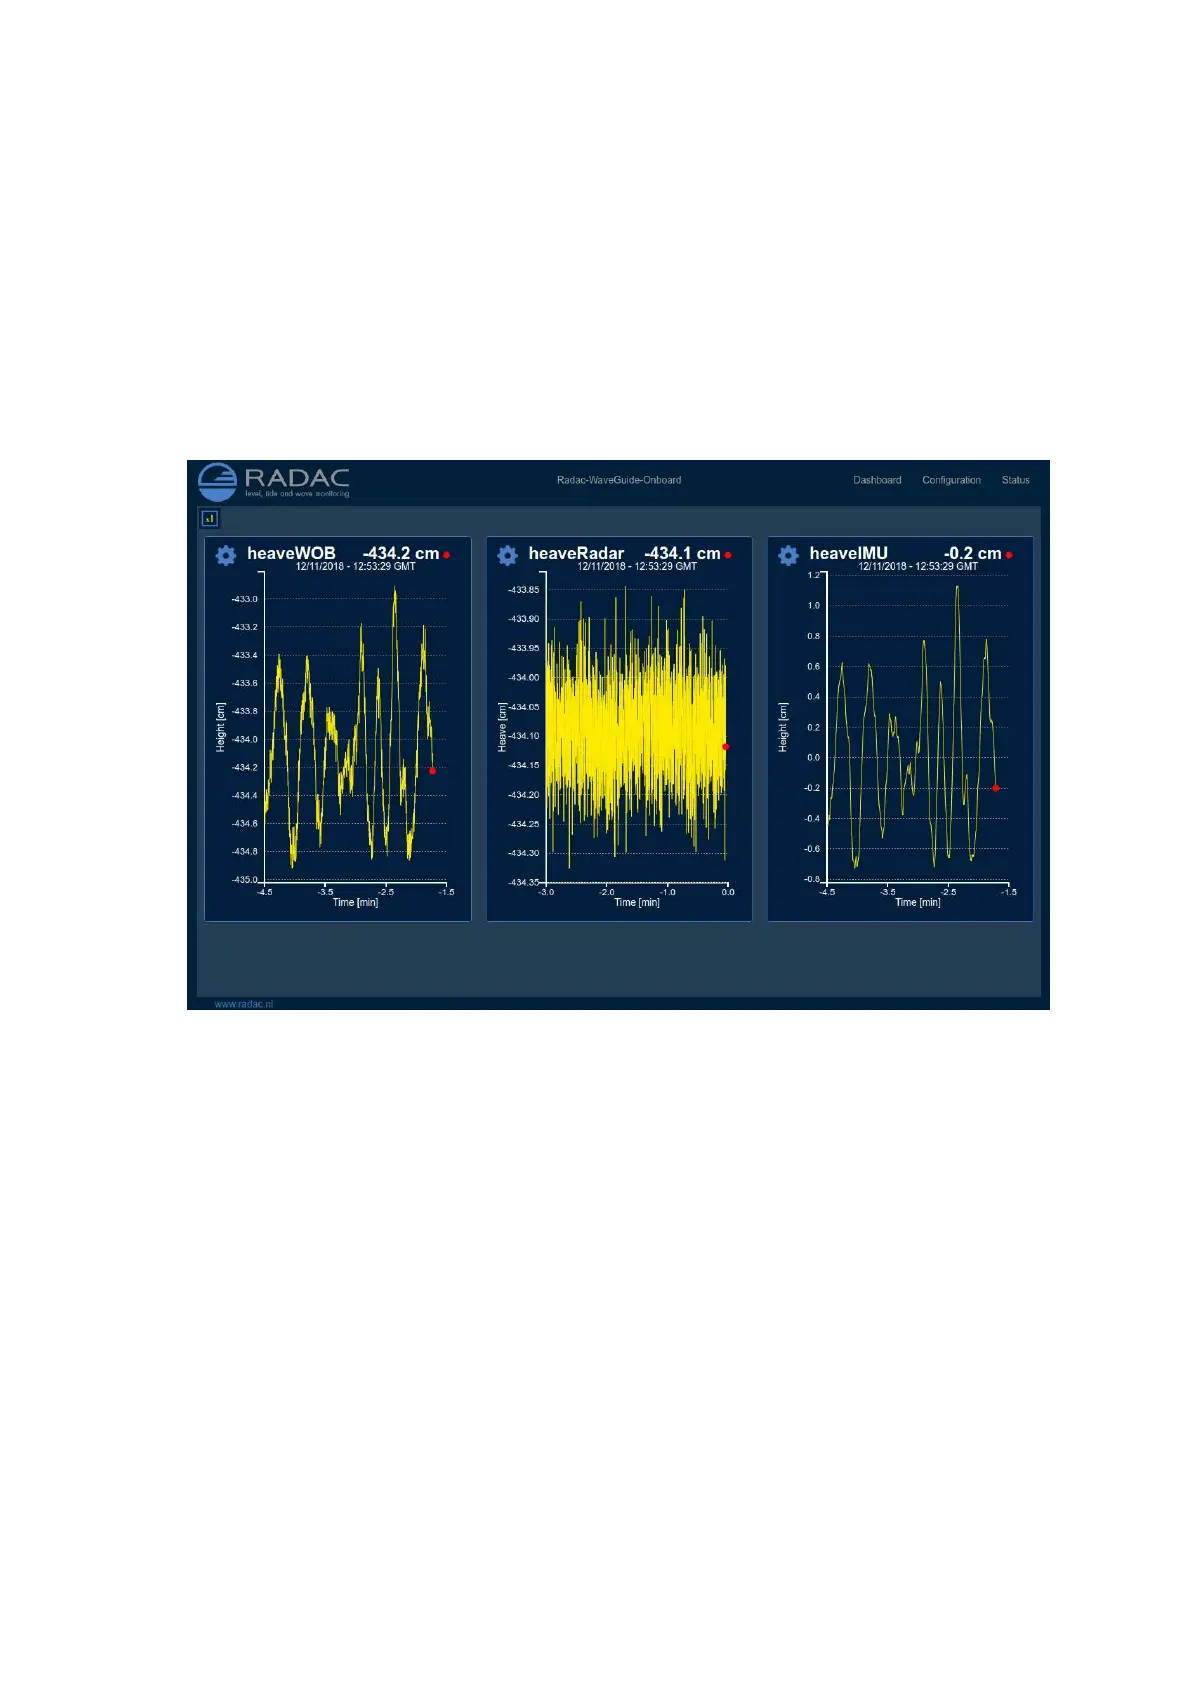
The ’Dashboard’ page, gives the possibility to view plots of different measured and calcu-
lated parameters. Please note that, as a result of calculations preformed some parameters
are shown with a constant delay such as heaveIMU and heaveWOB (100 and 120 [sec] of
delay). Also, that it takes up to 10 minute of gathering data to calculate and plot statistical
parameters.
Please inspect the available heave graphs (Fig. 3.9) to visually confirm the measured data
with reality.
Figure 3.7: The dashboard page provides plots of the diferent measurements and calculated parameters.
23