24 | SAMLEX AMERICA INC.
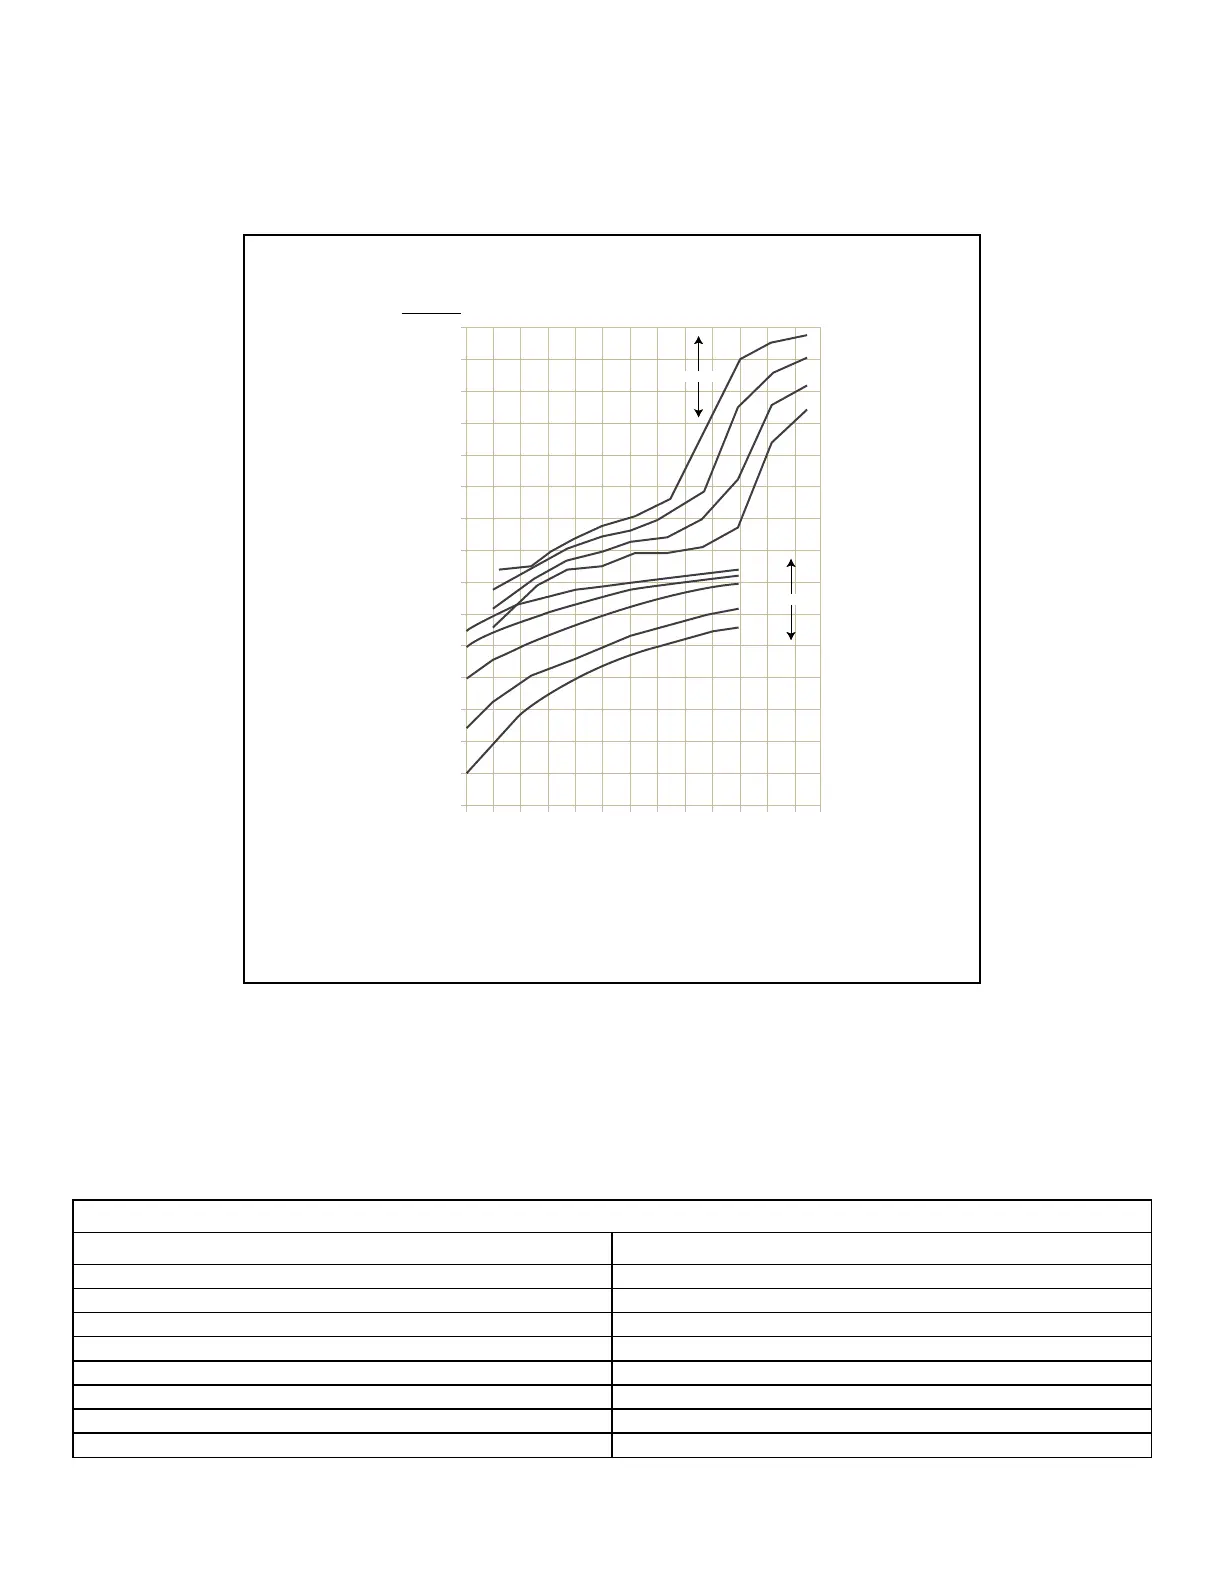
Typical 12V/24V Flooded Lead-Acid Battery Chart - 80˚F / 26.7˚C
Battery Voltage in VDC
Battery State of Charge in Percent (%)
0 10 20 30 40 50 60 70 80 90 100 110 120 130
16.5
16.0
15.5
15.0
14.5
14.0
13.5
13.0
12.5
12.0
11.5
11.0
10.5
10.0
9.5
9.0
C/5
C/40
C/20
C/10
DISCHARGE
CHARGE
C/20
C/3
C/5
C/10
C/100
33.0
32.0
31.0
30.0
29.0
28.0
27.0
26.0
25.0
24.0
23.0
22.0
21.0
20.0
19.0
18.0
24V 12V
Fig 1.4.1 Charging / Discharging Curves for Typical 12V/24V Flooded Lead Acid Battery
1.4.12 Reduction in Usable Capacity at Higher Discharge Rates – Typical in Inverter Application
As stated earlier, the Ah capacity of automotive battery is normally applicable at a C-rate of C/20 (or, 0.05C). As the
discharge rate is increased as in cases where the inverters are driving higher capacity loads, the usable Ah capacity
reduces due to “Peukert Effect”. This relationship is not linear but is more or less according to the Table 1.4.3.
TABLE 1.4.3 BATTERY CAPACITY VERSUS RATE OF DISCHARGE – C-rate
C-rate Discharge Current Usable Capacity (%)
C/20 or, 0.05C 100%
C/10 or, 0.10C 87%
C/8 or, 0.125C 83%
C/6 or, 0.17C 75%
C/5 or, 0.20C 70%
C/3 or, 0.34C 60%
C/2 or, 0.50C 50%
1C 40%
SECTION 1.4 | General Information – Battery Related