SAMWONTECH
4st Edition of TEMI2000_Series IM : Aug. 18. 2009 Page 45 / 55
6.3 Recording TREND GRAPH on internal memory
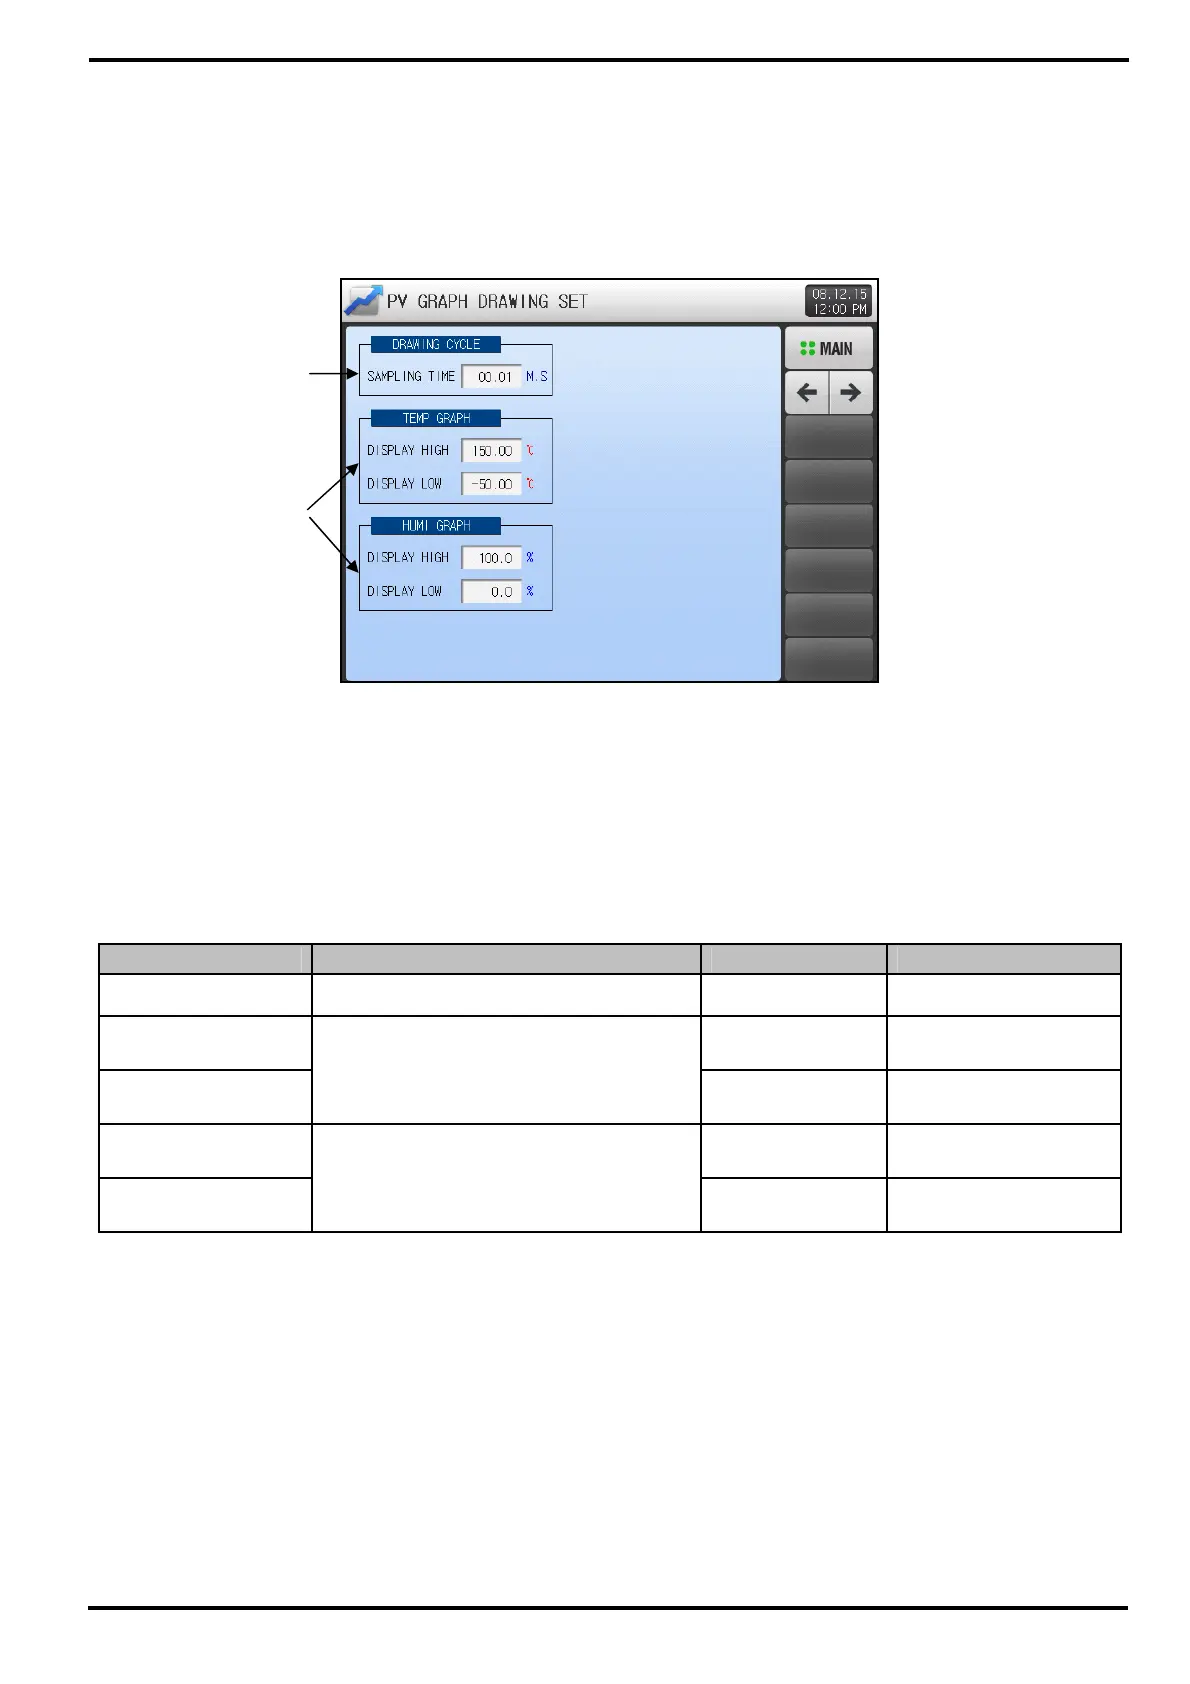
▶ This screen is to establish parameters for recording data on [3.3.4 The 3
rd
PROGRAM RUN screen] or
[3.2.3 The 2
nd
FIX RUN screen].
① Setup box to establish sampling time for recording on internal memory.
☞ Cannot be adjusted when the PV graph is being saved.
☞ About 37days can be saving on 1 second of sampling time.
② Setup box for display range of temperature/humidity.
Table 6-2. Trend Graph setting screen Parameters
Parameter Set Range Units Primary Value
DRAWING CYCLE 0.01 ~ 99.59 (min,sec) ABS 00.01
TEMP
DISPLAY HIGH
T.EU T.EU(100.00%)
TEMP
DISPLAY LOW
T.EU(-2.50 ~ 102.50%)
(TEMP DISPLAY LOW < TEMP DISPLAY HIGH)
T.EU T.EU(0.00%)
HUMI
DISPLAY HIGH
H.EU H.EU(100.0%)
HUMI
DISPLAY LOW
H.EU(0.0 ~ 100.0%)
(HUMI DISPLAY LOW < HUMI DISPLAY HIGH)
H.EU H.EU(0.0%)
①
②
[Figure 6-3] Trend Graph setting screen

 Loading...