SARK
SARKSARK
SARK-
--
-110
110110
110
User’s Manual
Rev 1.2.6 October 3
rd
, 2015 - 32 - © Melchor Varela – EA4FRB 2011-2015
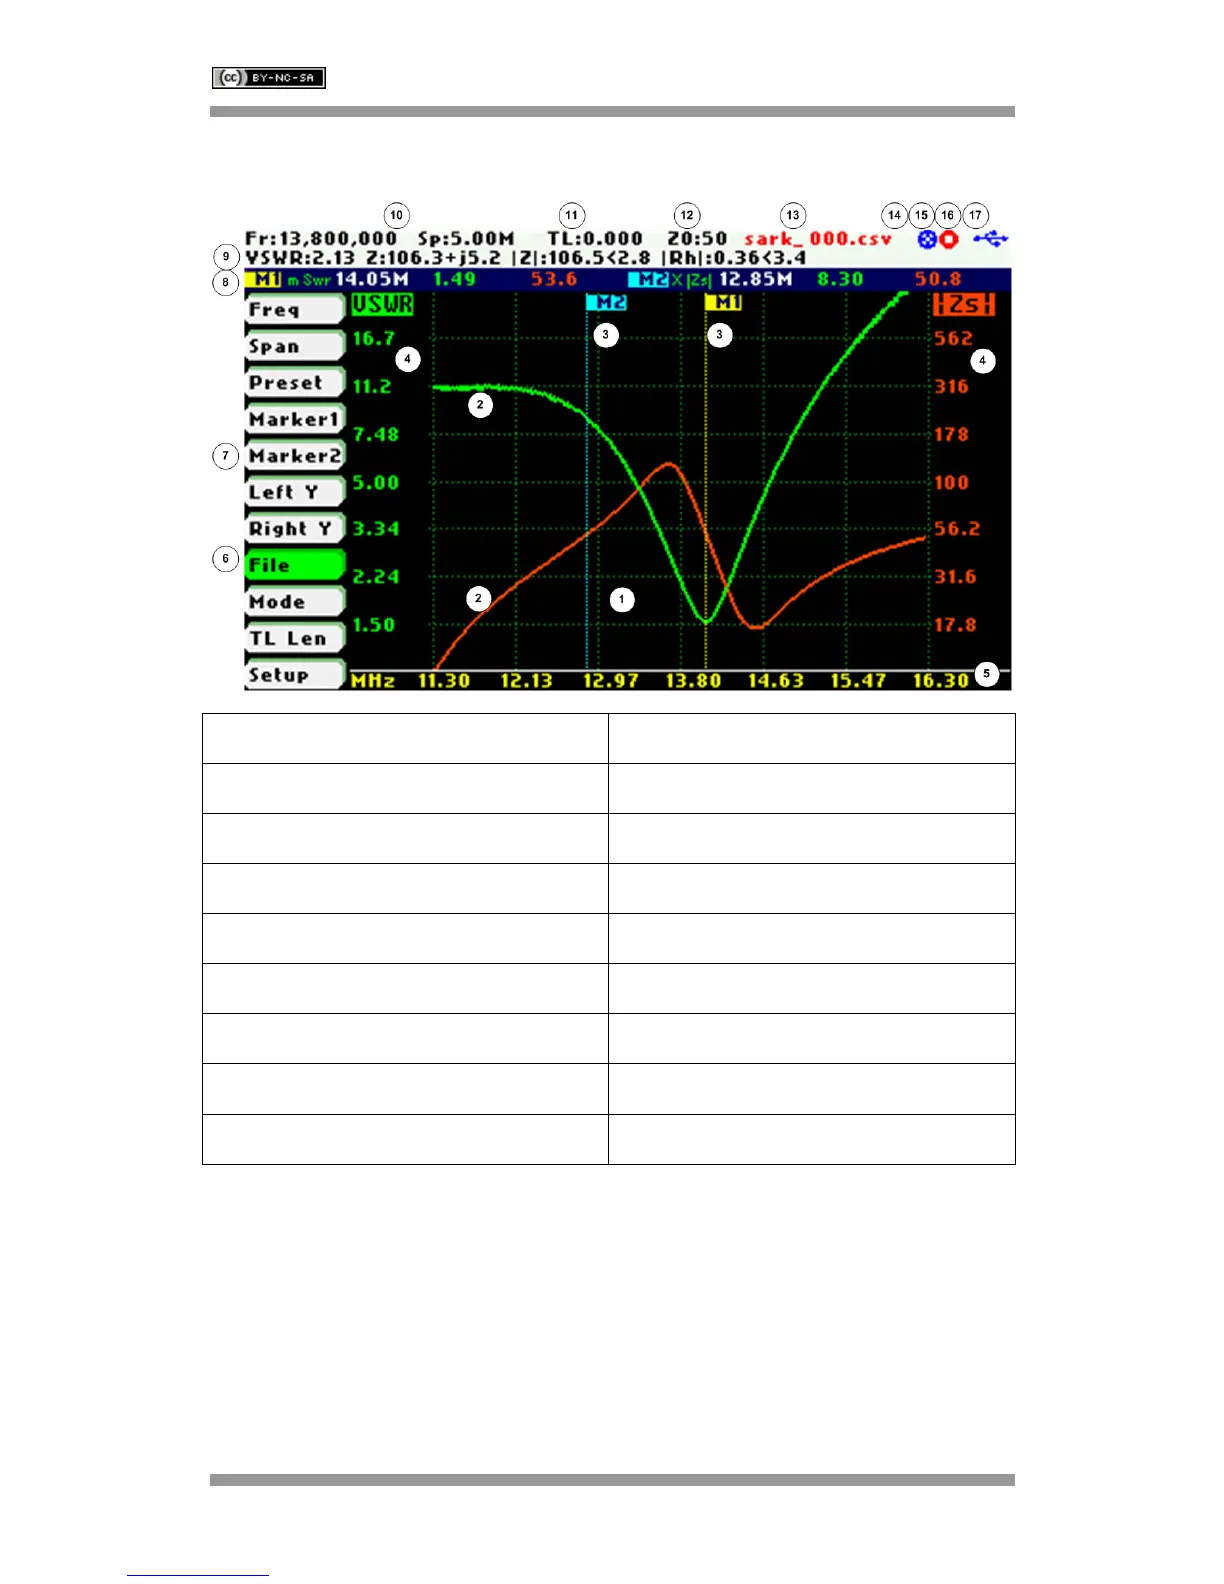
5 Scalar Chart Mode
1 Diagram 10 Frequency and span settings
2 Traces 11 Transmission Line length setting
3 Markers 12 Reference impedance setting
4 Vertical axis labeling 13 Loaded data file name
5 Frequency axis labeling 14 Disk write operation in progress
6 Highlighted menu option 15 Calibration status
7 Main menu 16 Run/Hold status
8 Markers information 17 USB/Battery status
9 Detailed measurements
The Scalar Chart mode provides functionality for impedance measurements of antennas,
transmission lines, and RF circuits. The analyzer performs reflection measurements within a
user-specified frequency range, defined by the frequency and the span. The two user-selectable
fundamental parameters are displayed as a Cartesian diagram. Up to two markers can be
selected to provide precise information in the plotted areas. Their positions can either be user-
selected or automatically tracked. They are also useful for indicating characteristic points in the
plot.