SARK
SARKSARK
SARK-
--
-110
110110
110
User’s Manual
Rev 1.2.6 October 3
rd
, 2015 - 34 - © Melchor Varela – EA4FRB 2011-2015
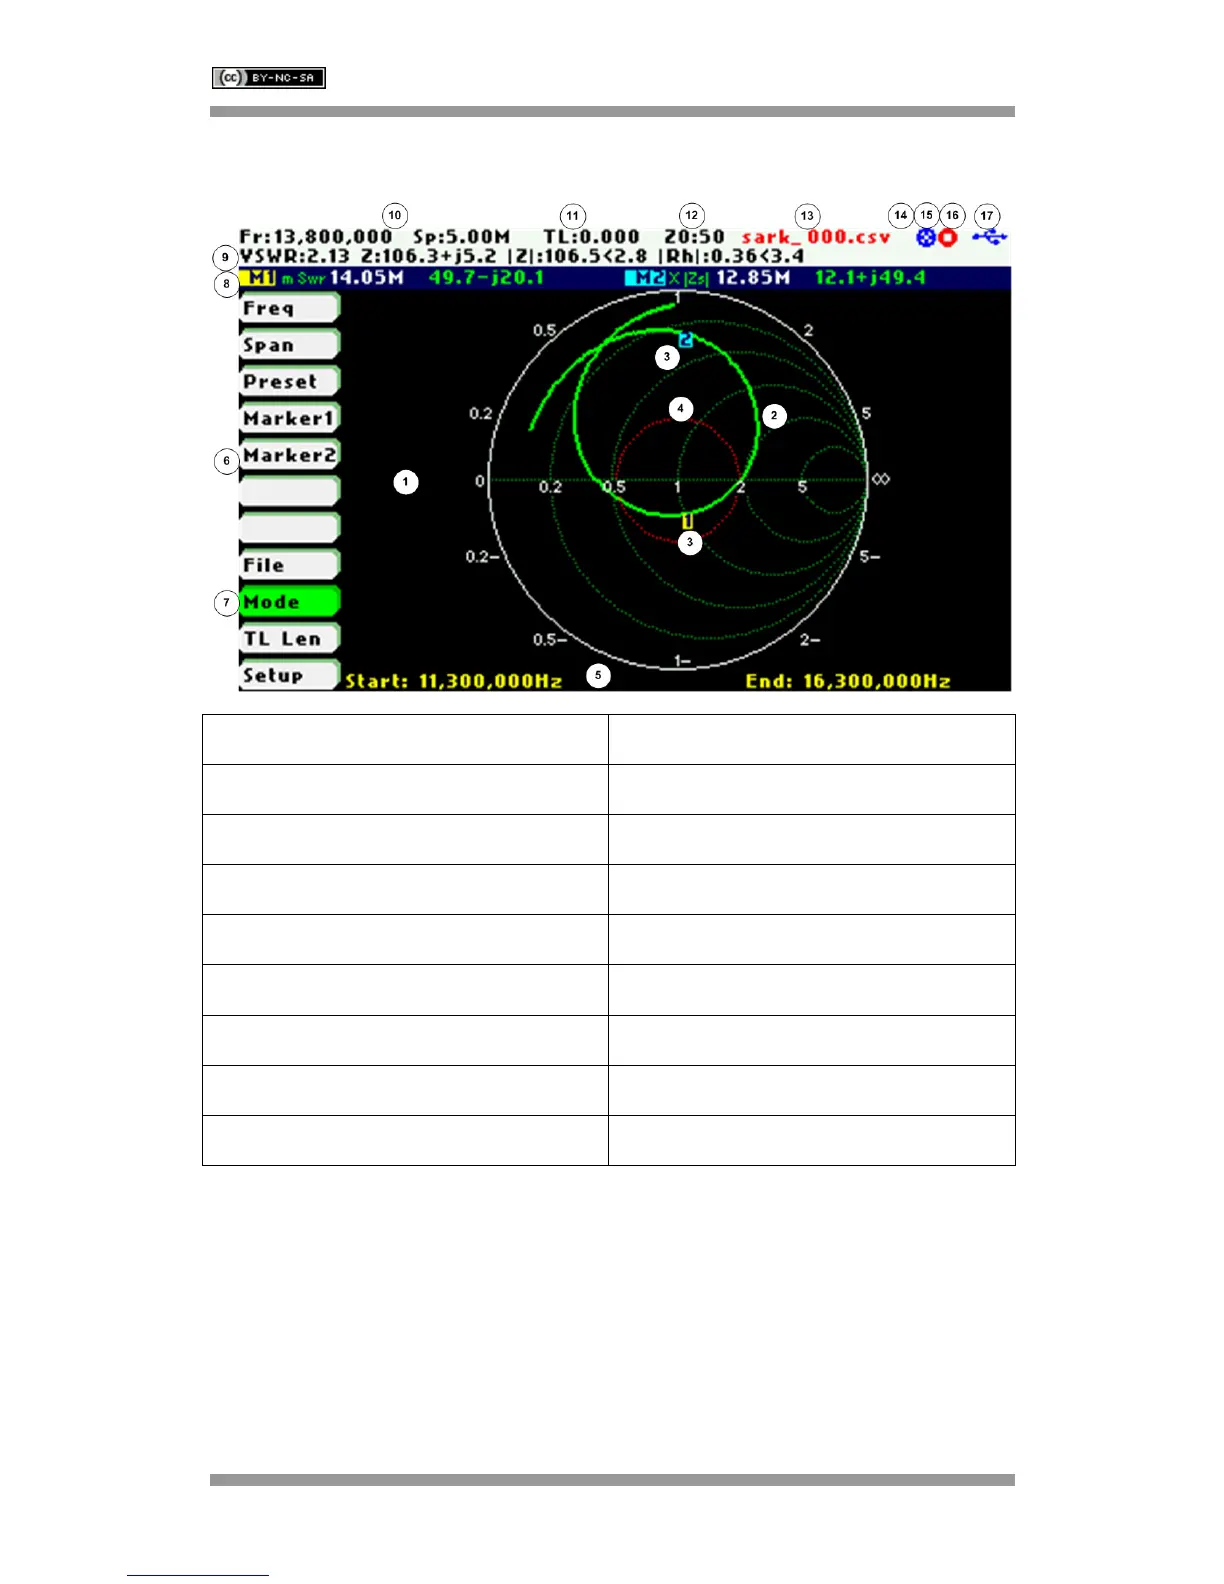
6 Smith Chart Mode
1 Diagram 10 Frequency and span settings
2 Trace 11 Transmission Line length setting
3 Markers 12 Reference impedance setting
4 Constant impedance circle 13 Loaded data file name
5 Frequency start and end 14 Disk write operation in progress
6 Main menu 15 Calibration status
7 Highlighted menu option 16 Run/Hold status
8 Markers information 17 USB/Battery status
9 Detailed measurements
The Smith Chart mode is equivalent to the Scalar Chart mode but in this case the complex
reflection measurements for the user-specified frequency range are displayed in a Smith Chart
diagram.
Use Navigator A to highlight «Mode» in the main menu. Press the Select [■] button to activate
the Mode popup submenu and use Navigator B to highlight «Smith Chart» submenu mode
option. Finally press the Select [
■] button to enter into Smith Chart mode.