19
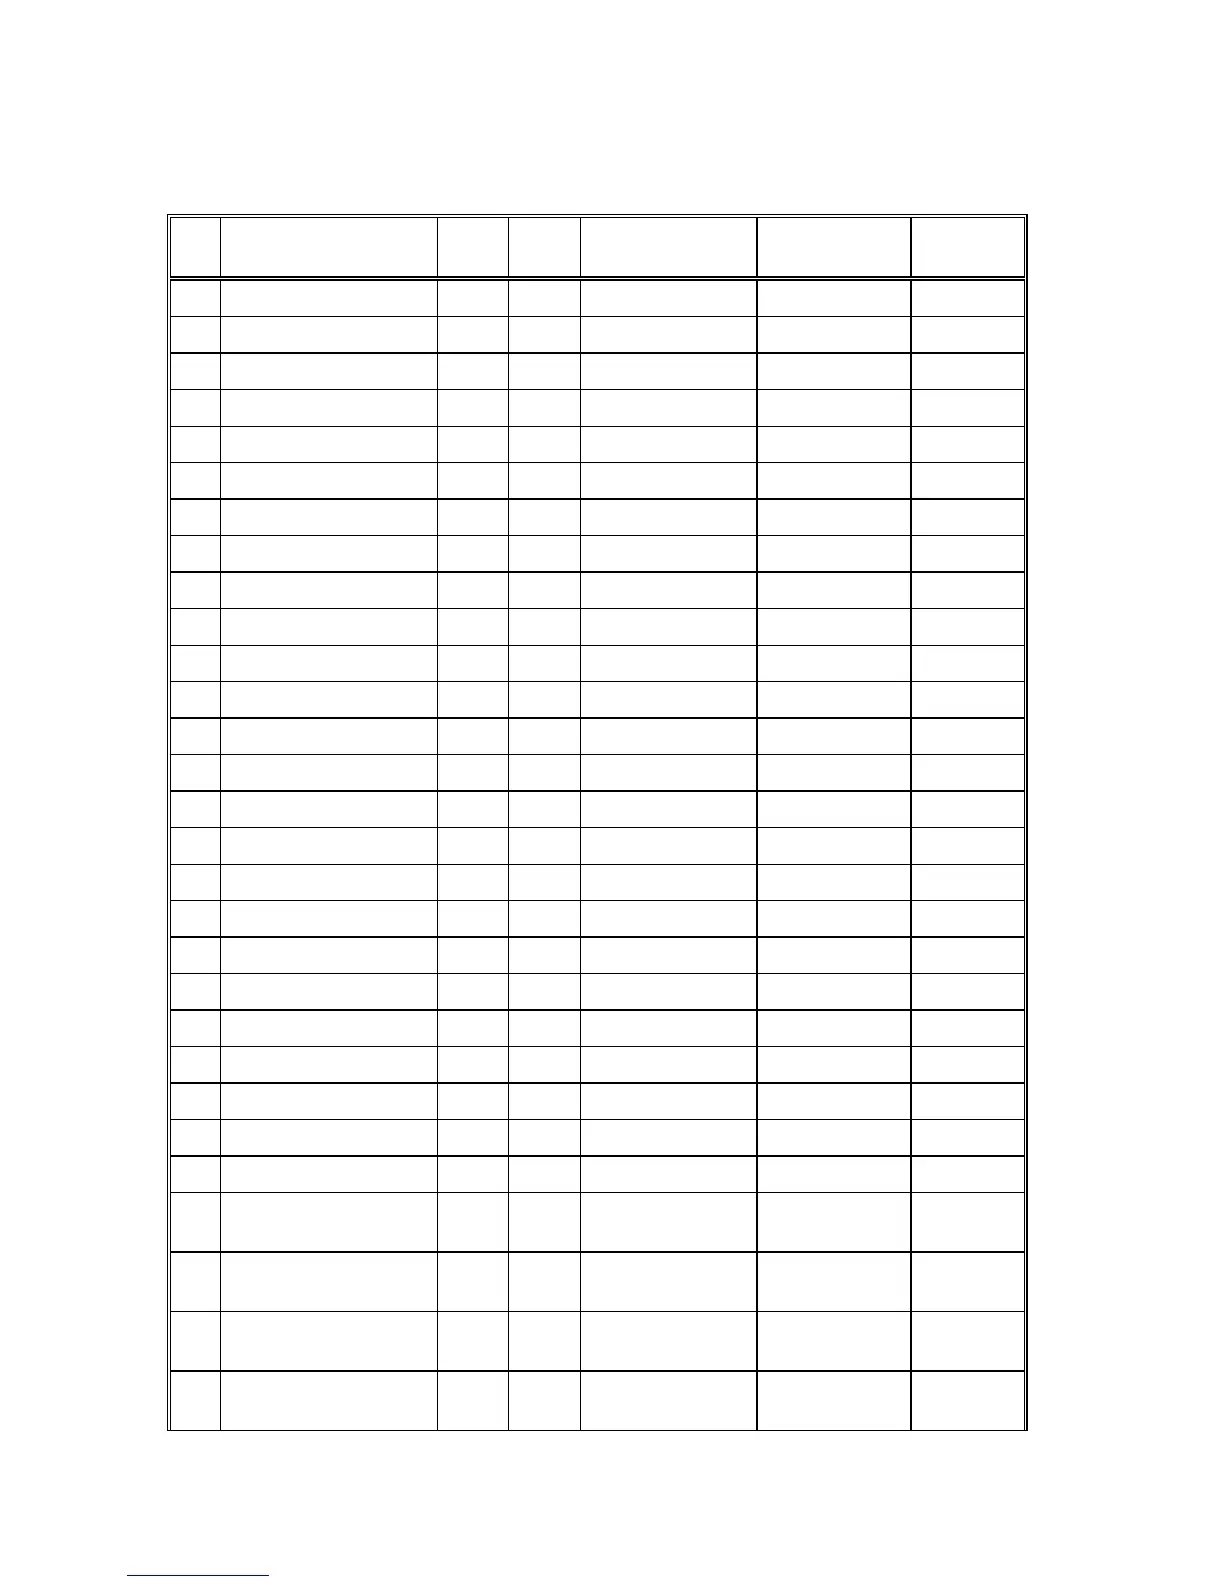
2.5.2 Measured Data Table
Powermeter Internal Table #1
No Parameter Add-
ress
Bytes Data Conversion
Method
HI Scale LO Scale
1 Voltage A 0 2 LIN3 Vmax 0
2 Voltage B 1 2 LIN3 Vmax 0
3 Voltage C 2 2 LIN3 Vmax 0
4 Current A 3 2 LIN3 Imax 0
5 Current B 4 2 LIN3 Imax 0
6 Current C 5 2 LIN3 Imax 0
7 Power A 6 2 LIN3 Pmax -Pmax
8 Power B 7 2 LIN3 Pmax -Pmax
9 Power C 8 2 LIN3 Pmax -Pmax
10 Reactive Power A 9 2 LIN3 Pmax -Pmax
11 Reactive Power B 10 2 LIN3 Pmax -Pmax
12 Reactive Power C 11 2 LIN3 Pmax -Pmax
13 Apparent Power A 12 2 LIN3 Pmax -Pmax
14 Apparent Power B 13 2 LIN3 Pmax -Pmax
15 Apparent Power C 14 2 LIN3 Pmax -Pmax
16 Power factor A 15 2 LIN3 1.00 -1.00
17 Power factor B 16 2 LIN3 1.00 -1.00
18 Power factor C 17 2 LIN3 1.00 -1.00
19 Average Power factor 18 2 LIN3 1.00 -1.00
20 Total Active Power 19 2 LIN3 Pmax -Pmax
21 Total Reactive Power 20 2 LIN3 Pmax -Pmax
22 Total Apparent Power 21 2 LIN3 Pmax -Pmax
23 Unbalanced Current 22 2 LIN3 Imax 0
24 Frequency 23 2 LIN3 65.00 45.00
25 Maximum Demand 24 2 LIN3 Pmax -Pmax
26 Accumulated
Maximum Demand
25 2 LIN3 Pmax -Pmax
27 Maximum Apparent
Demand
26 2 LIN3 Pmax -Pmax
28 Accumulated
Apparent Demand
27 2 LIN3 Pmax -Pmax
29 Ampere Maximum
Demand A
28 2 LIN3 Imax 0
 Loading...