ST144-21 C/Ku-Band TVRO Maintenance and Troubleshooting
13-17
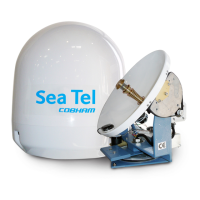
• The Cross Level display should decrease (plots below red line) as the antenna is tilted to the left and
increase (plots above red line) as the antenna tilted to the right.
• The Level display should decrease (plots below red line) as the antenna is tilted forward and increase
(plots above red line) as the antenna is tilted back.
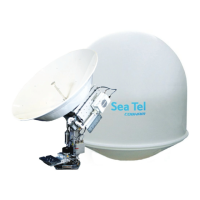
• The Azimuth display should decrease (plots below red line) as the antenna is rotated CCW and
increase (plots above red line) as the antenna is rotated CW. In the example below, the output of
the Azimuth rate sensor is plotted above the reference line, indicating that the antenna was driven
CW in Azimuth. Due to the in-practicality of driving an axis at a consistent rate, verification of rate
sensor output is, for the most part restricted to a positive or negative response of the Level Cage
movement (plotting above or below the red reference line of each axis).
 Loading...