Electricity usage history
By touching the Graphs button on the History
screen will display a range of graphs that will show
how much net electricity you have used over the
last 24 hours, 45 days, 8 weeks or 13 months.
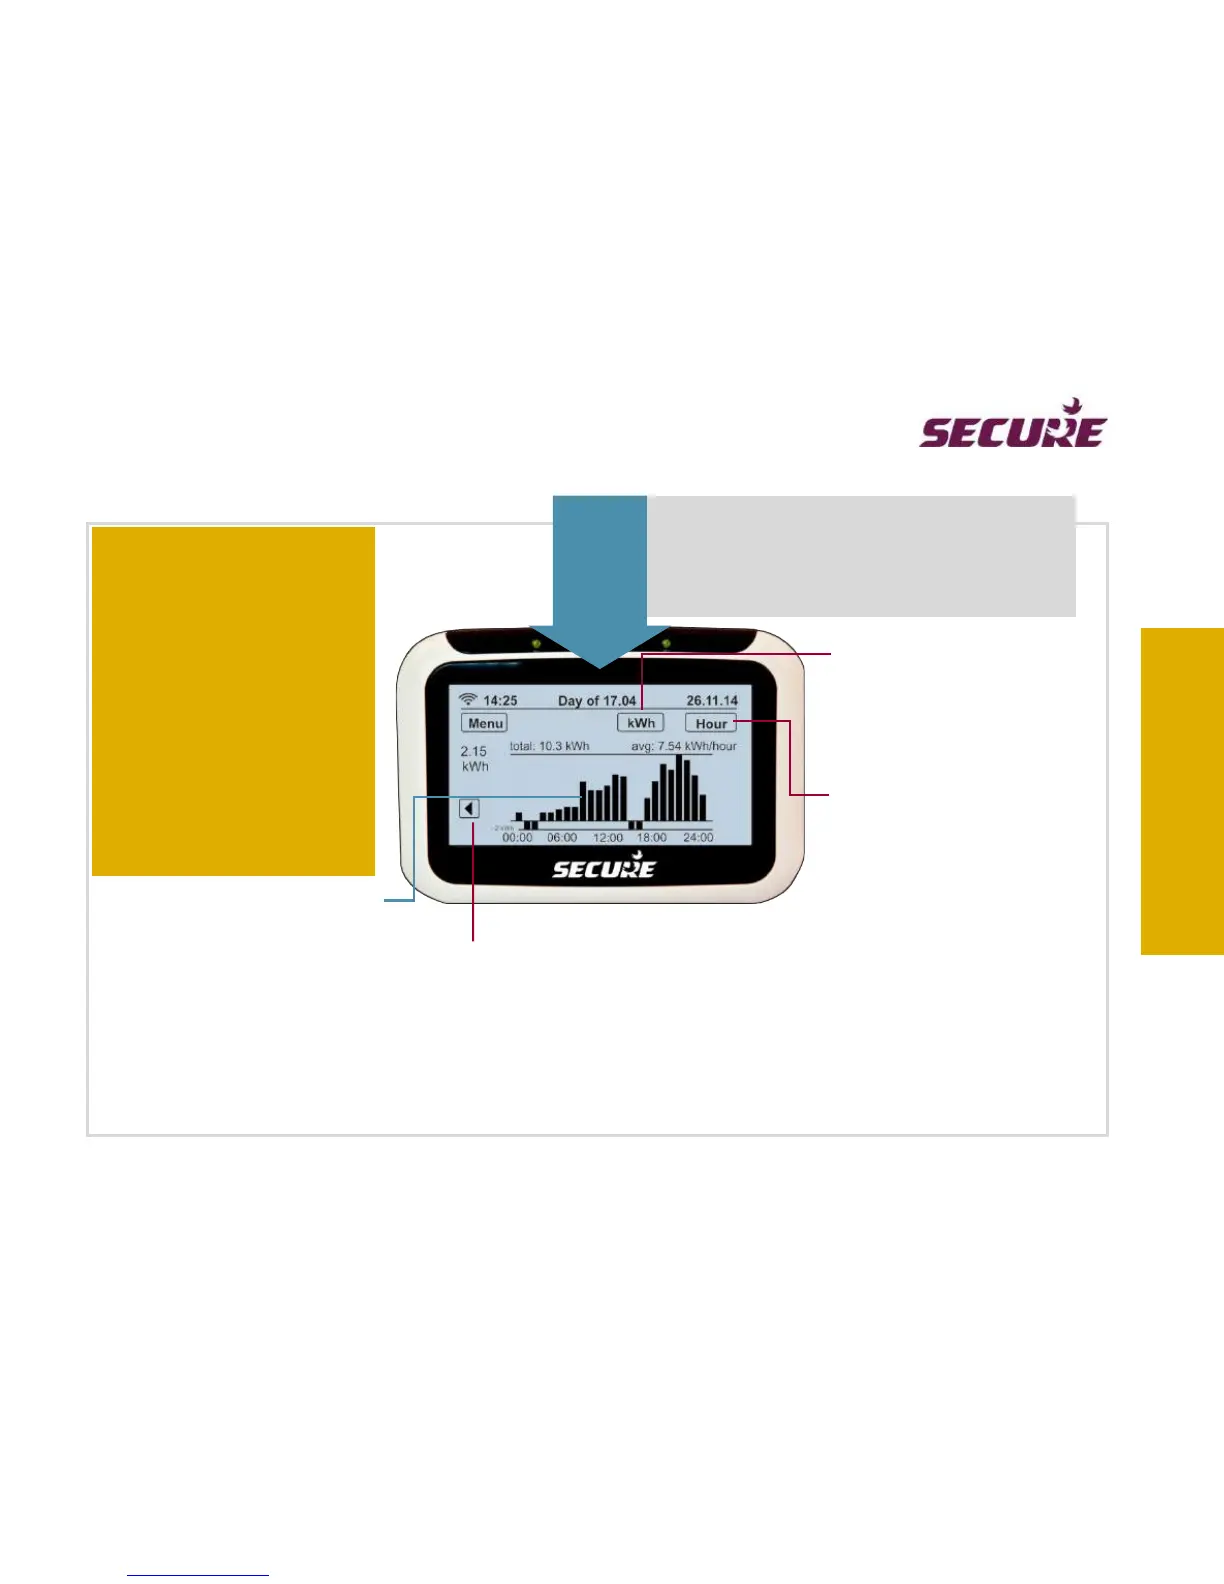
Press this Hour button to
display your net electricity
usage graph over the last 45
days, press again to see the
last 8 weeks graph, press
once again to see the last 13
months graph on this screen.
Press the kWh button to see
CO2 emissions, press again to
see the cost ($) on this screen.
Press to scroll backwards through the
graph to see data for previous 45 days.
Graphs
Tap on a bar to see further breakup
of daily, weekly or monthly graph.
What is a kWh?
Electricity usage is
measured in kilowatt-hours
(kWh) unit. kWh represents
the amount of electricity
used.
1 kWh = 1,000 watt-hours
For example, a typical small
freezer consumes
approximately 1,000 watt-
hours a day.
This graph displays your net hourly electricity usage in the last 24 hours and reads as follows:
In the last 24 hours your highest electricity usage on hourly basis is 2.15 kWh; your total electricity usage is 10.3 kWh; your
average electricity usage is 7.54 kWh and your highest electricity generation is 2kWh (shown as negative).
 Loading...
