EasyManuals Logo

Secure Pipit 500 Consumers Manual

Secure Pipit 500
44 pages
To Next Page IconTo Next Page
To Previous Page IconTo Previous Page
Page #16 background imageLoading...
Page #16 background image
16
History graph
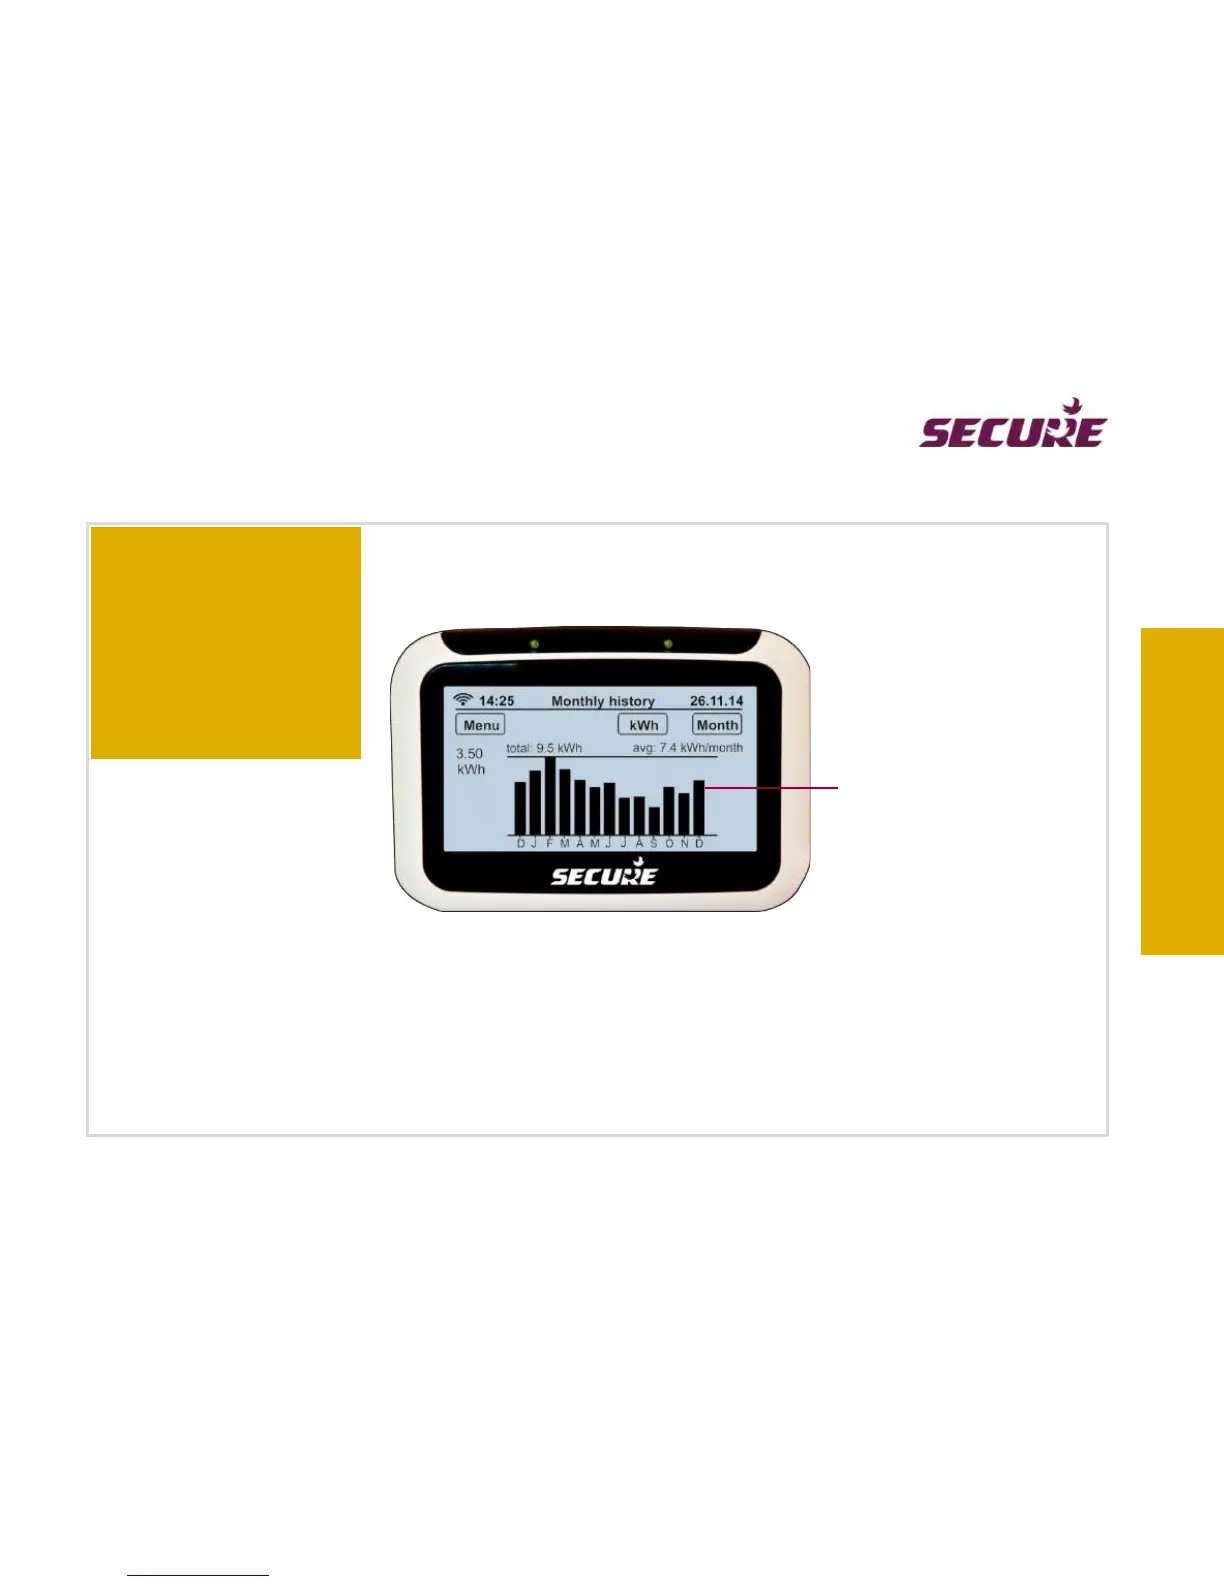
Your net monthly electricity usage graph for current and preceding 12 calendar months
Tap on a bar to see weekly
breakup of your net electricity
usage of the selected month.
This net monthly electricity usage graph tells your highest electricity usage in 13 months is 3.5 kWh, your total
electricity usage is 9.5 kWh and your monthly average electricity usage is 7.4 kWh.
See your monthly usage
pattern at a glance!
Take a note of the months
you have spent most and
less on electricity.

Other manuals for Secure Pipit 500

Questions and Answers:

Question and Answer IconNeed help?

Do you have a question about the Secure Pipit 500 and is the answer not in the manual?

Secure Pipit 500 Specifications

General IconGeneral
BrandSecure
ModelPipit 500
CategoryMonitor
LanguageEnglish