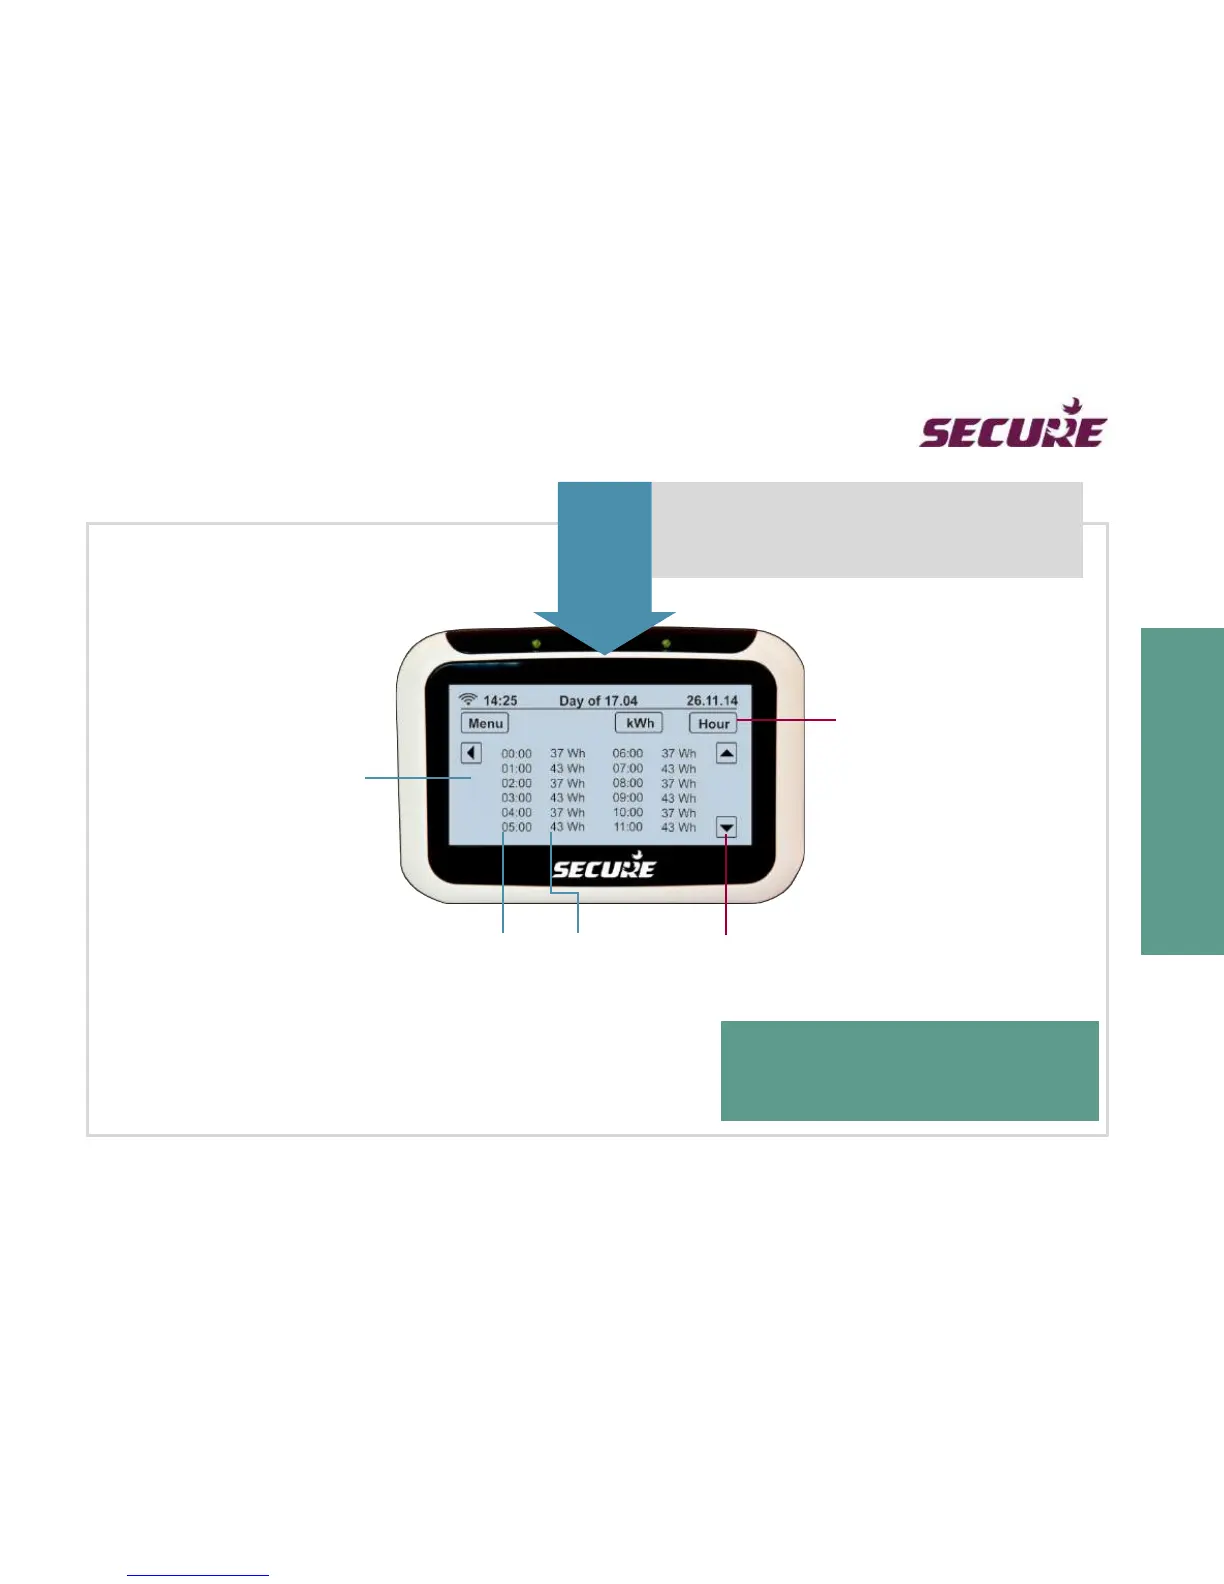
Electricity usage data table
Table
By touching the Table button on the History screen
will display your net electricity usage over the last
24 hours, 45 days, 7 weeks or 12 months.
This is how much net electricity
you have used on hourly basis
in the last 24 hours.
Press this Hour button to
display your net electricity
usage over the last 45 days,
press again to see net usage
over the last 7 weeks, press
once again to the see net usage
over the last 12 months.
Press to scroll forward to see
data outside the display region.
Net instantaneous value = electricity
used minus electricity generated.
 Loading...
