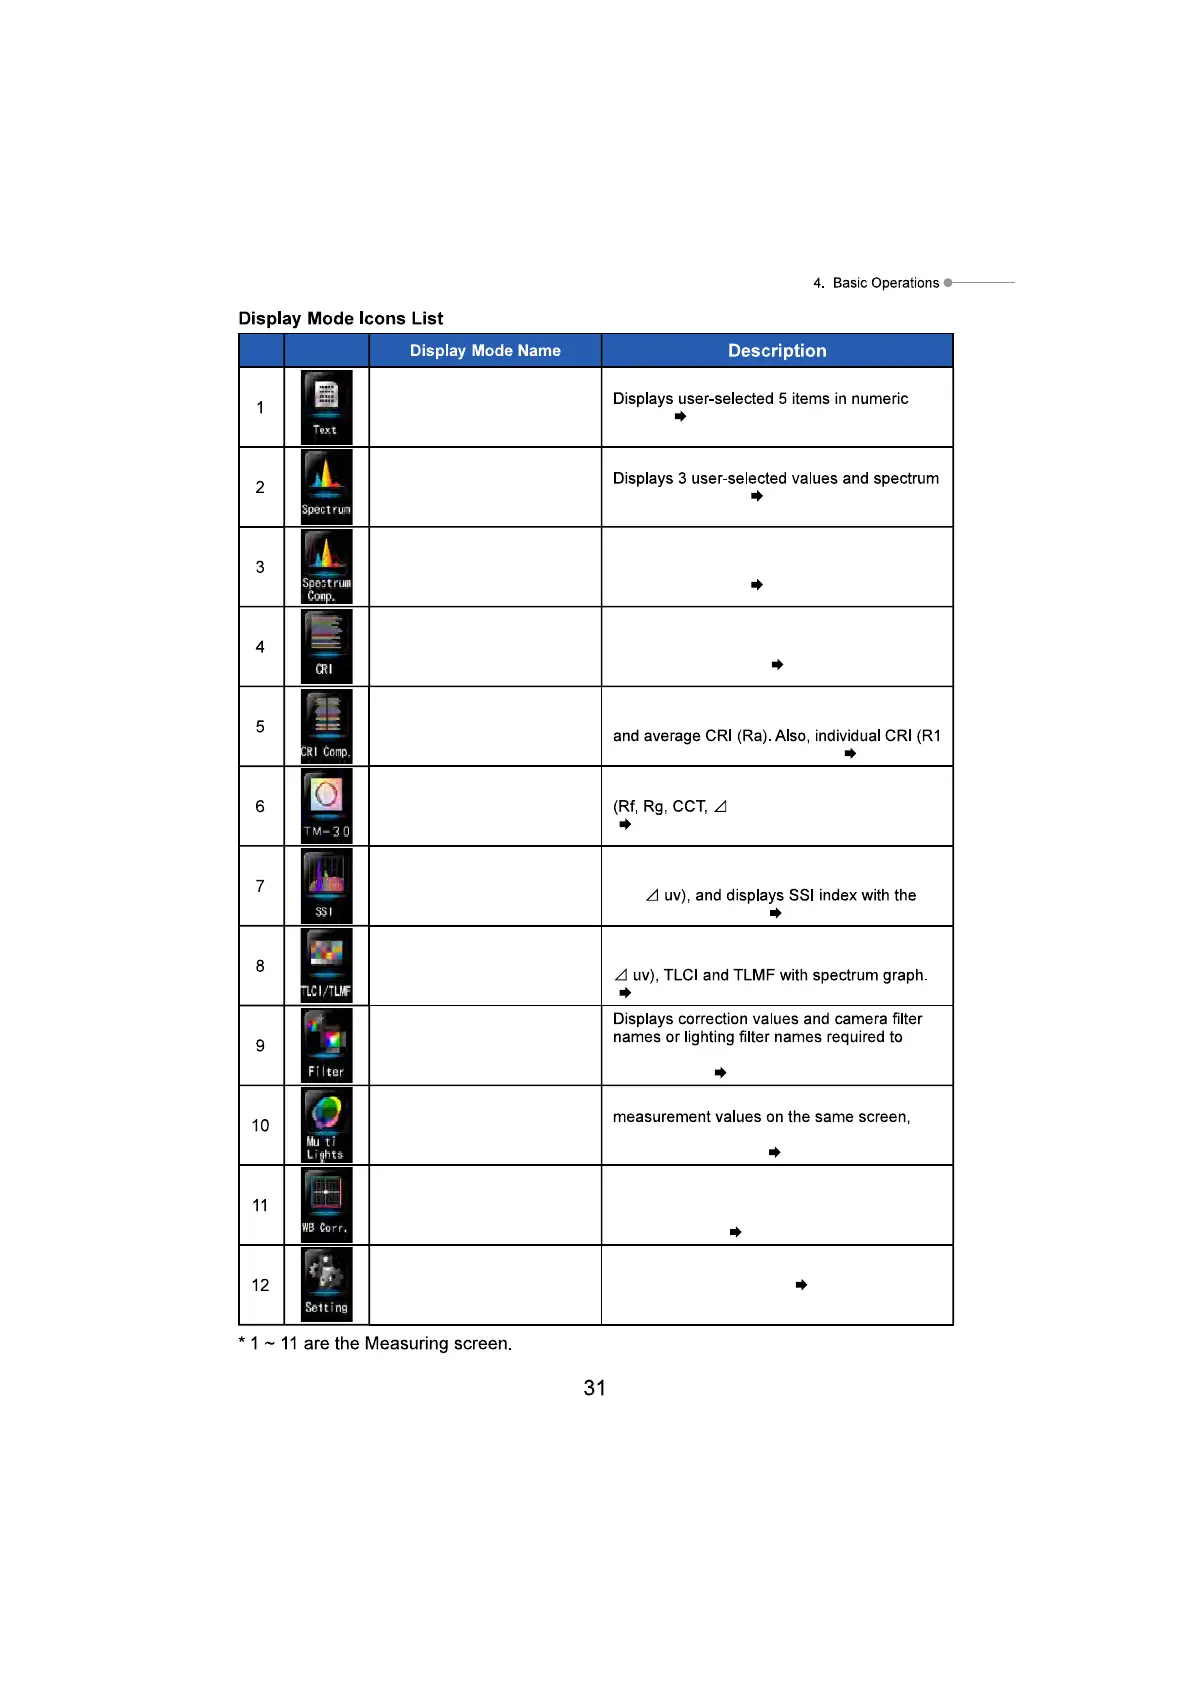
No. Icon
[Text] Icon
values. ( P34)
[Spectrum] Icon
distribution graph. ( P37)
[Spectrum Comparison]
Icon
Compares the current measurement value
and up to 2 memorized values in the spectrum
distribution graph. (
P39)
[CRI] Icon
Displays the average CRI (Ra) or individual
CRI (R1 ~ R15) numerically. Each CRI is
displayed in a graph. (
P43)
[CRI Comparison] Icon
Compares the current measurement value and
memoried value to show the color temperature
to R15) is displayed in a graph. ( P45)
[TM-30] Icon
Displays four current measurement values
uv) and color vector graphic.
(
P49)
[SSI] Icon
Compares the current measurement value and
up to 2 reference values (color temperature
and
SSI spectrum graph. ( P51)
[TLCI/TLMF] Icon
Displays the current measurement values and
memorized values (in color temperature and
( P62)
[Filter] Icon
adjust measured light source to target color
temperature. (
P66)
[Multi Lights] Icon
Displays and compares up to four
Displays the correction value from the selected
measurement value. (
P74)
[White Balance Correction]
Icon
Displays correction values in LB index and CC
index between the current measurement value
and the target color temperature in a white
balance graph. (
P81)
[Setting] Icon Displays Setting screen. ( P83)
 Loading...