133
GRAPHING FUNCTIONS
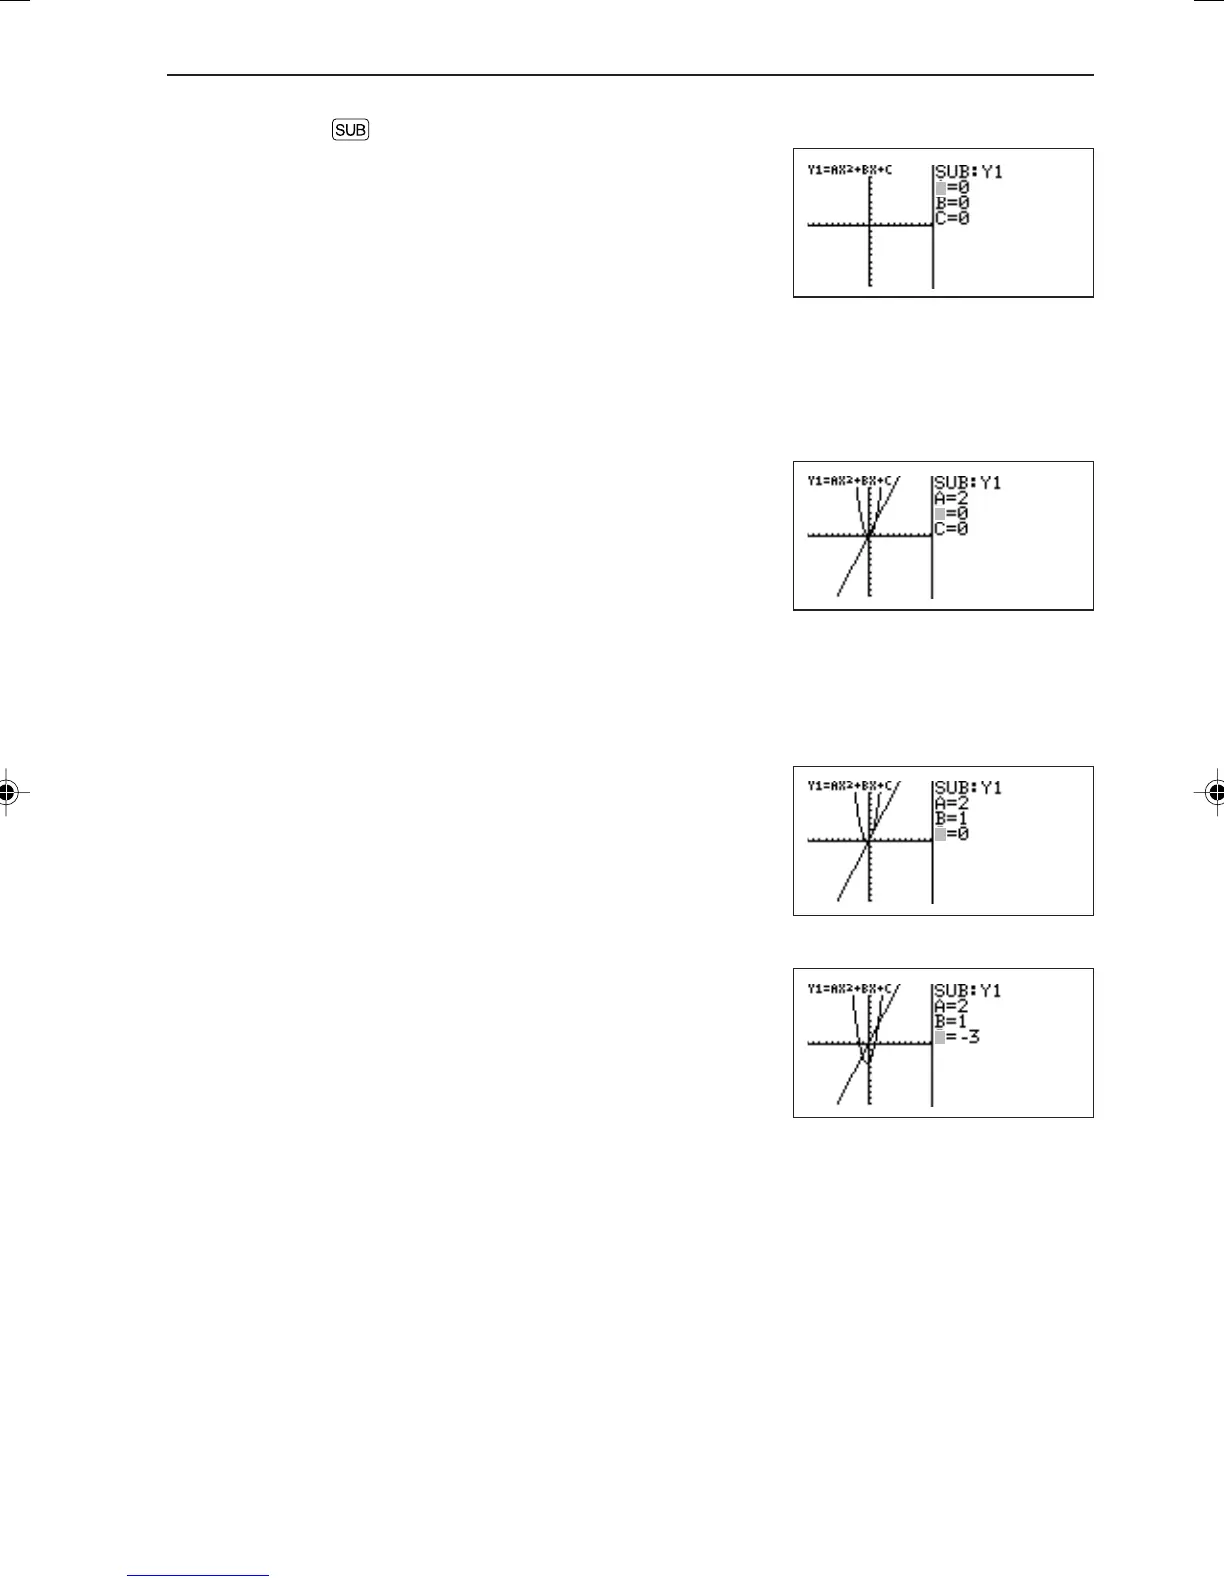
1. Press Ï .
The substitution graph screen will appear. The equation
on which the cursor pointer is located and its variables
are displayed on the right of the screen.
If variables (characters) contain no values, the graph is
not drawn.
If independent memories A to C contain any numeric values, the graph is drawn
based on these values.
* If the equation (in this example, Y1) on which the cursor is located contains no variables, the
substitution graph screen will not appear.
2. Press 2 ®. (2 is input to A.)
The graph for “Y1 = 2X
2
” is drawn. (Since B and C have
no values, they are ignored.)
At this time, the graph for Y2 is also drawn. Y2 also
uses variable A which is used in Y1. Therefore, the
drawing of the graph for Y2 is also valid.
* If you need to draw only the graph for Y2, it is necessary to change variables (characters) or
make the graph drawing invalid.
3. Press 1 ®. (1 is input to B.)
The graph is changed from “Y1 = 2X
2
” to “Y1 = 2X
2
+
1X”.
4. Press — 3 ®. (-3 is input to C.)
Now, the graph for “Y1 = 2X
2
+ 1X – 3” is drawn on the
screen.
B
C
C
B
A
EL-9650-(04)En (079-134) 8/7/00, 9:08 PM133