165
STATISTICS/ REGRESSION CALCULATIONS
for US
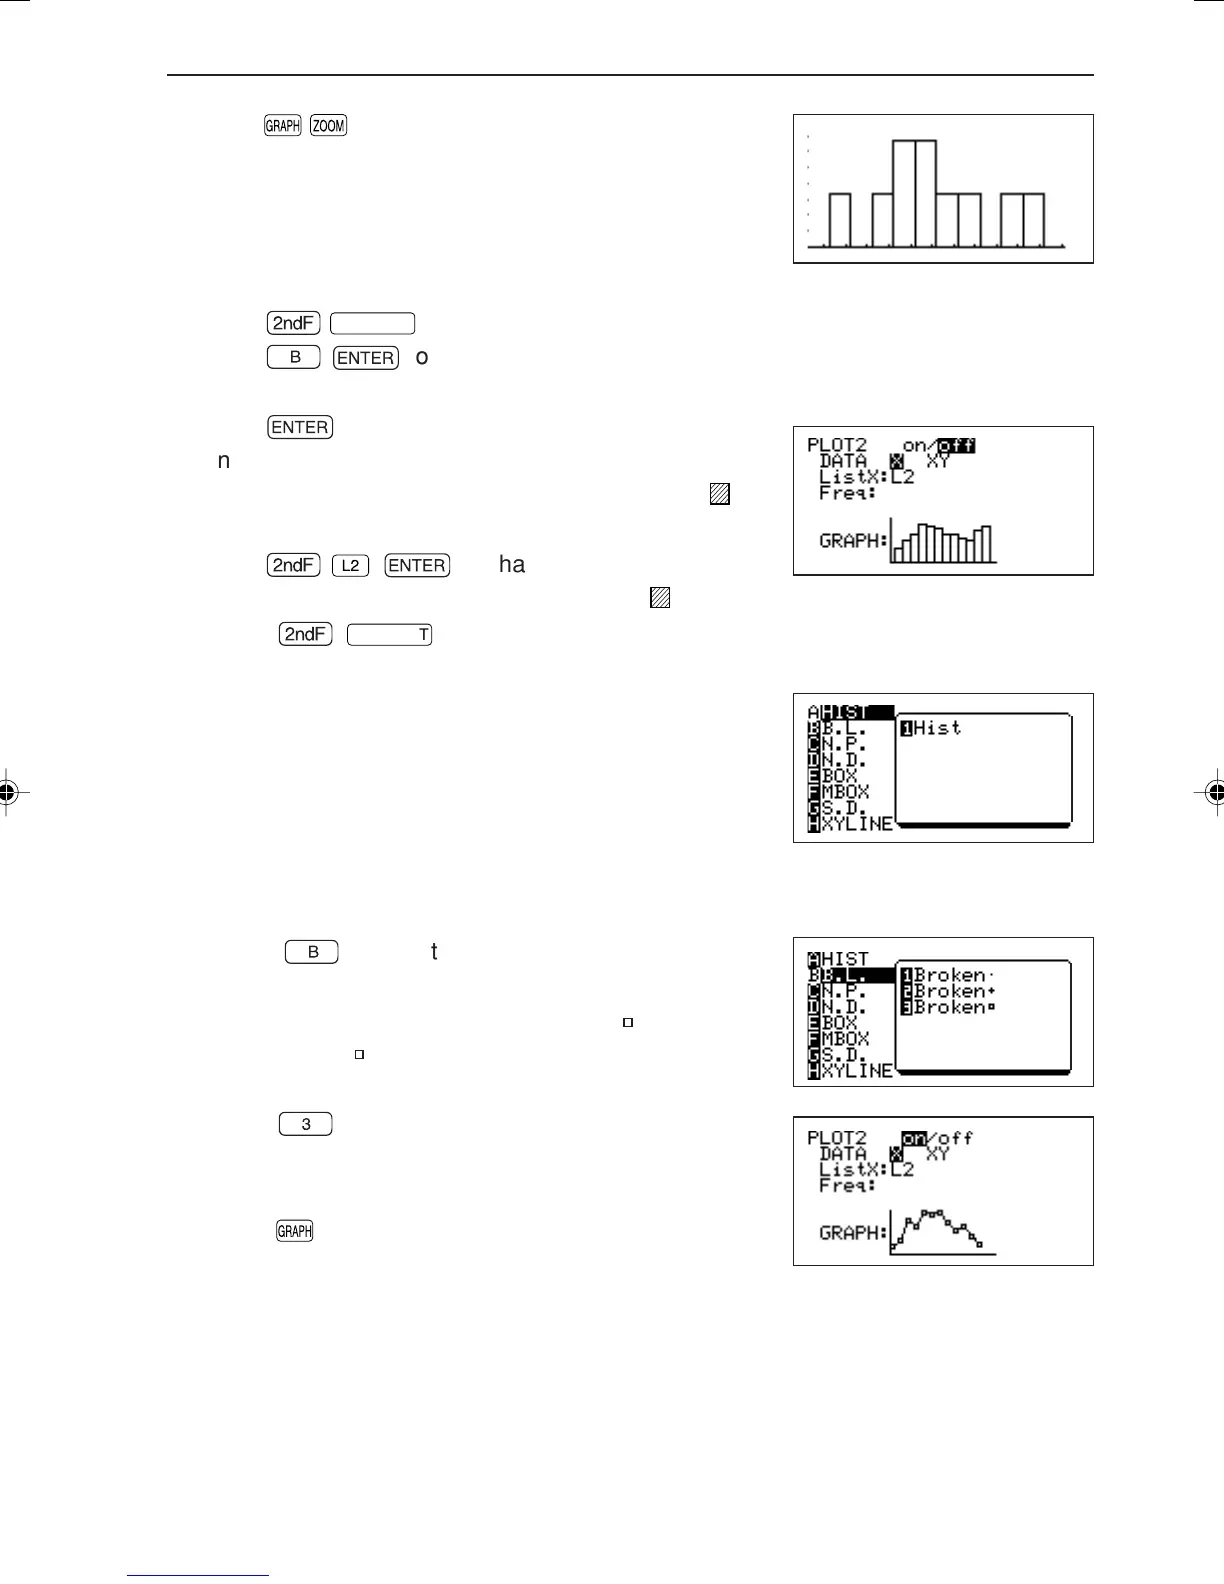
3. Press
[A ZOOM] [9 Stat]. The graph shown
on the right will appear.
Next, we will set the graph for the physics scores (L2).
4. Press
Ï
STATPLOT
.
5. Press
B
®
to display the same type setting screen as above. The only
difference is that PLOT2 will be displayed on the top left corner of the screen.
6. Press
®
.
“on” will be highlighted.
7. Press ≥≥ to move the cursor pointer to “
L
ist X:
L1”.
8. Press
Ï
®
to change to “List X: L2”.
9. Press ≥ to move the cursor pointer to “
G
RAPH”.
10. Press
Ï
STATPLOT
to display the graph type selection screen shown below.
11. Press
B
to select the broken line plot.
[1 Broken•] displays points using “•”, [2 Broken+]
displays points using “+” and [3 Broken
] displays
points using “ ” .
12. Press
3
to return to the previous screen.
At this time, the graph image diagram located at the
bottom of the screen is changed.
13. Press
to graph the contents of list L2 using the
specified format.
•“Freq” on the screen indicates the space where frequency is entered. The frequency
list is entered in this space when data and the frequency for the data are entered as
a list, etc. at the time of creating a statistical data list.
Create a histogram
Create a broken line plot
Create a normal probability plot
Create a normal distribution plot
Create a box plot
Create a modified box plot
Create a scatter diagram
Create a XYline
→
→
→
→
→
→
→
→
EL-9650-(07)En (157-177) 8/1/00, 9:06 AM165