182
CHAPTER 7
for US
The test will be conducted using the previous data.
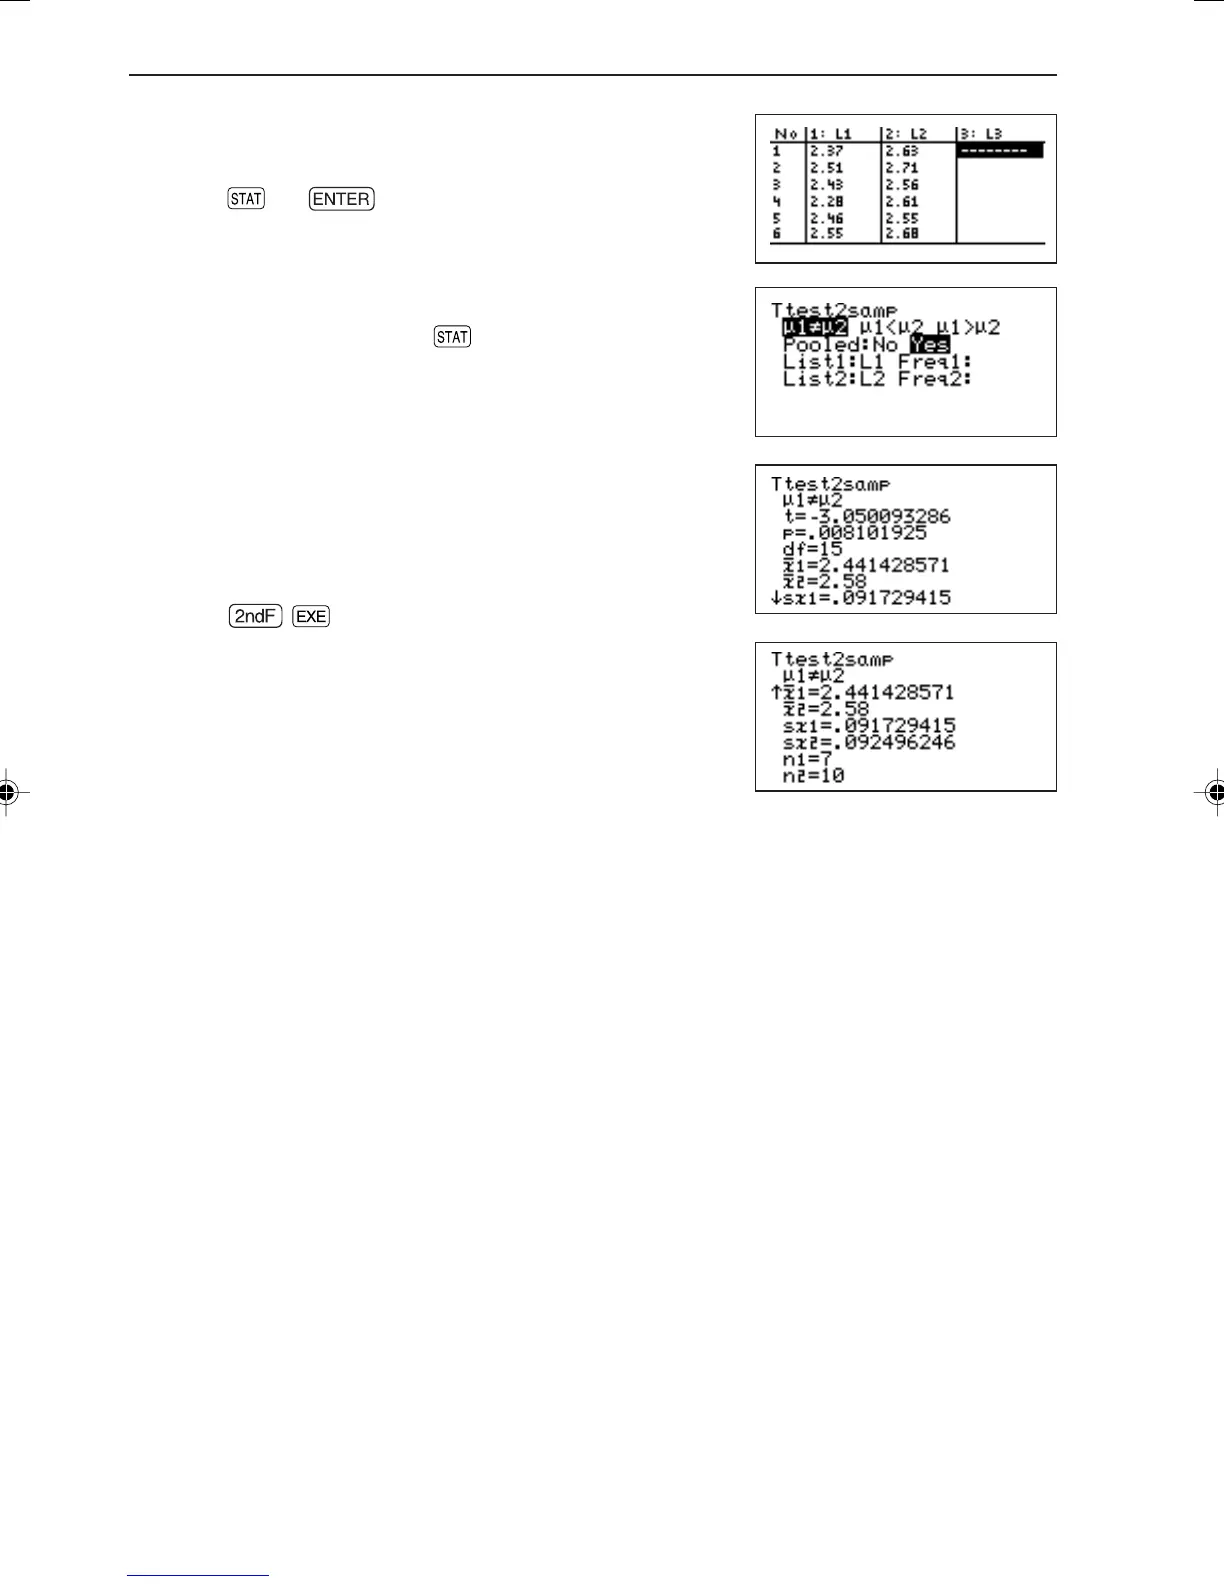
1. Set to the list input (InputList) mode
Press
A
®
to input data 1 to list 2 (L2) and
data 2 to list 3 (L3).
2. After inputting lists, press
E 0 4 to open the
parameter input screen of “Ttest2samp”, then input
each parameter and test method.
* When there is no Freq specification, calculation is
executed with weight as “1”.
* Pooled is prediction for unknown σ
1
, σ
2
.
Select “No” if σ
1
, σ
2
are subjectively unequal.
Select “Yes” if σ
1
, σ
2
are equal.
Calculation is executed using this prediction as the basis.
3. Press
Ï
to solve.
The answer is shown using two screens.
* “df” indicates degree of freedom.
[05 TtestLinreg]
Tests the hypothesis of slope β of linear regression straight line “Y = α + βx” and
correlation coefficient ρ of two dimensional sample data obtained from two different
populations.
<Example 5>
The test is conducted under the assumption that the value of slope β and correlation
coefficient ρ obtained from statistical data X (65, 56, 78, 86, 92, 71, 68) and Y (95, 59,
88, 78, 75, 68, 80) randomly extracted from two different populations are β & ρ ≠ 0.
EL-9650-(07)En (178-196) 8/1/00, 9:08 AM182