331
APPENDIX
EL-9650 functions
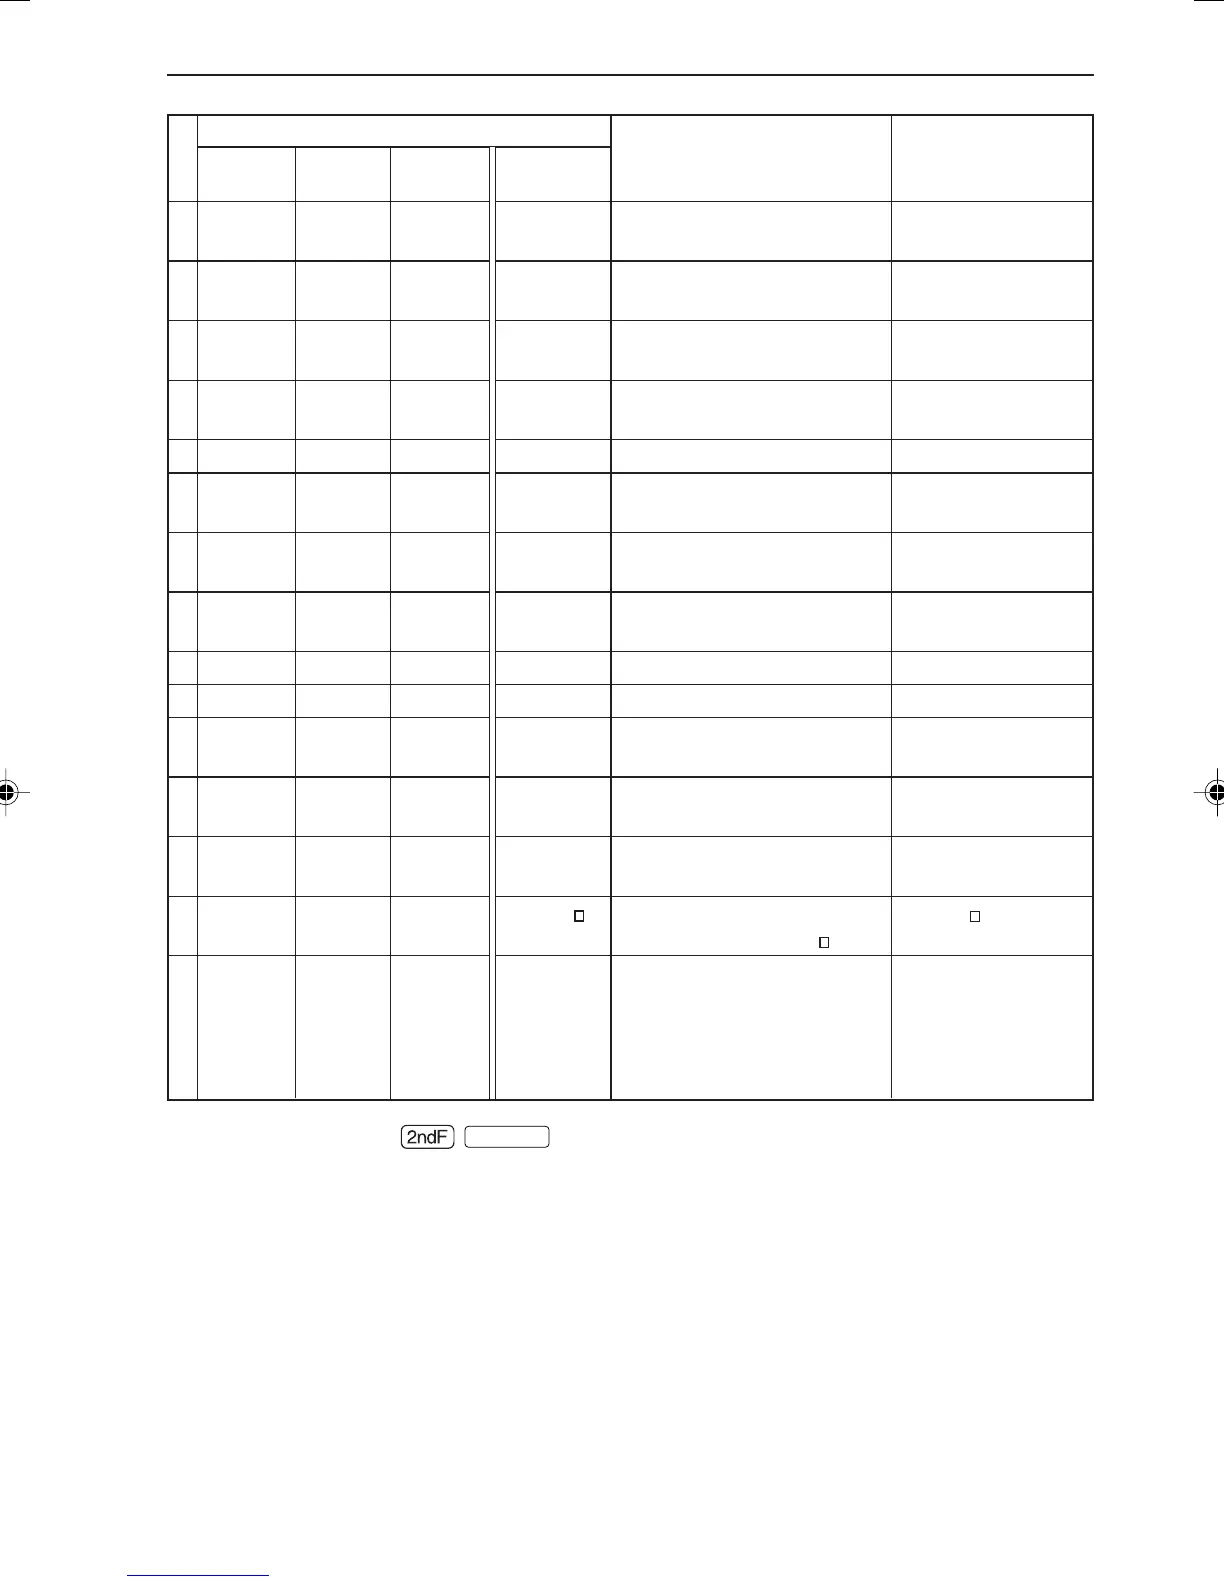
Major- Sub- Minor- Name Description Example of use
category category category
PRGM C NEW Sets new program create
mode
STAT A PLOT1 Specifies statistic graph 1 PLOT1
PLOT (PLOT1)
B PLOT2 Specifies statistic graph 2 PLOT2
(PLOT2)
C PLOT3 Specifies statistic graph 3 PLOT3
(PLOT3)
D LIMIT 1 SET Set limit line of statistic graph SET
2 LimON Draws limit line on statistic LimON
graph
3 LimOFF Does not draw limit line on LimOFF
statistic graph
E ON/ 1 PlotON Makes Plot1 - Plot3 valid Plot ON
OFF
2 PlotOFF Do not display plot1 - plot3 Plot OFF
STAT A HIST 1 Hist Specifies histogram Hist
GRAPH *
B B.L. 1 Broken • specifies broken line Broken •
plot using data point “•”
2 Broken + specifies broken line Broken +
plot using data point “+”
3 Broken specifies broken line Broken
plot using data point “ ”
C N.P. 1 Norm•_X Specifies X coordinate as Norm•_X
data value, Y coordinate as
inverse conversion value (z)
of normal distribution with
data point “•”
* Select by pressing
Ï
STATPLOT
in the STAT GRAPH settings screen of PLOT 1 to
3.
EL-9650-Appendix (327-338) 8/1/00, 9:41 AM331