333
APPENDIX
EL-9650 functions
Major- Sub- Minor- Name Description Example of use
category category category
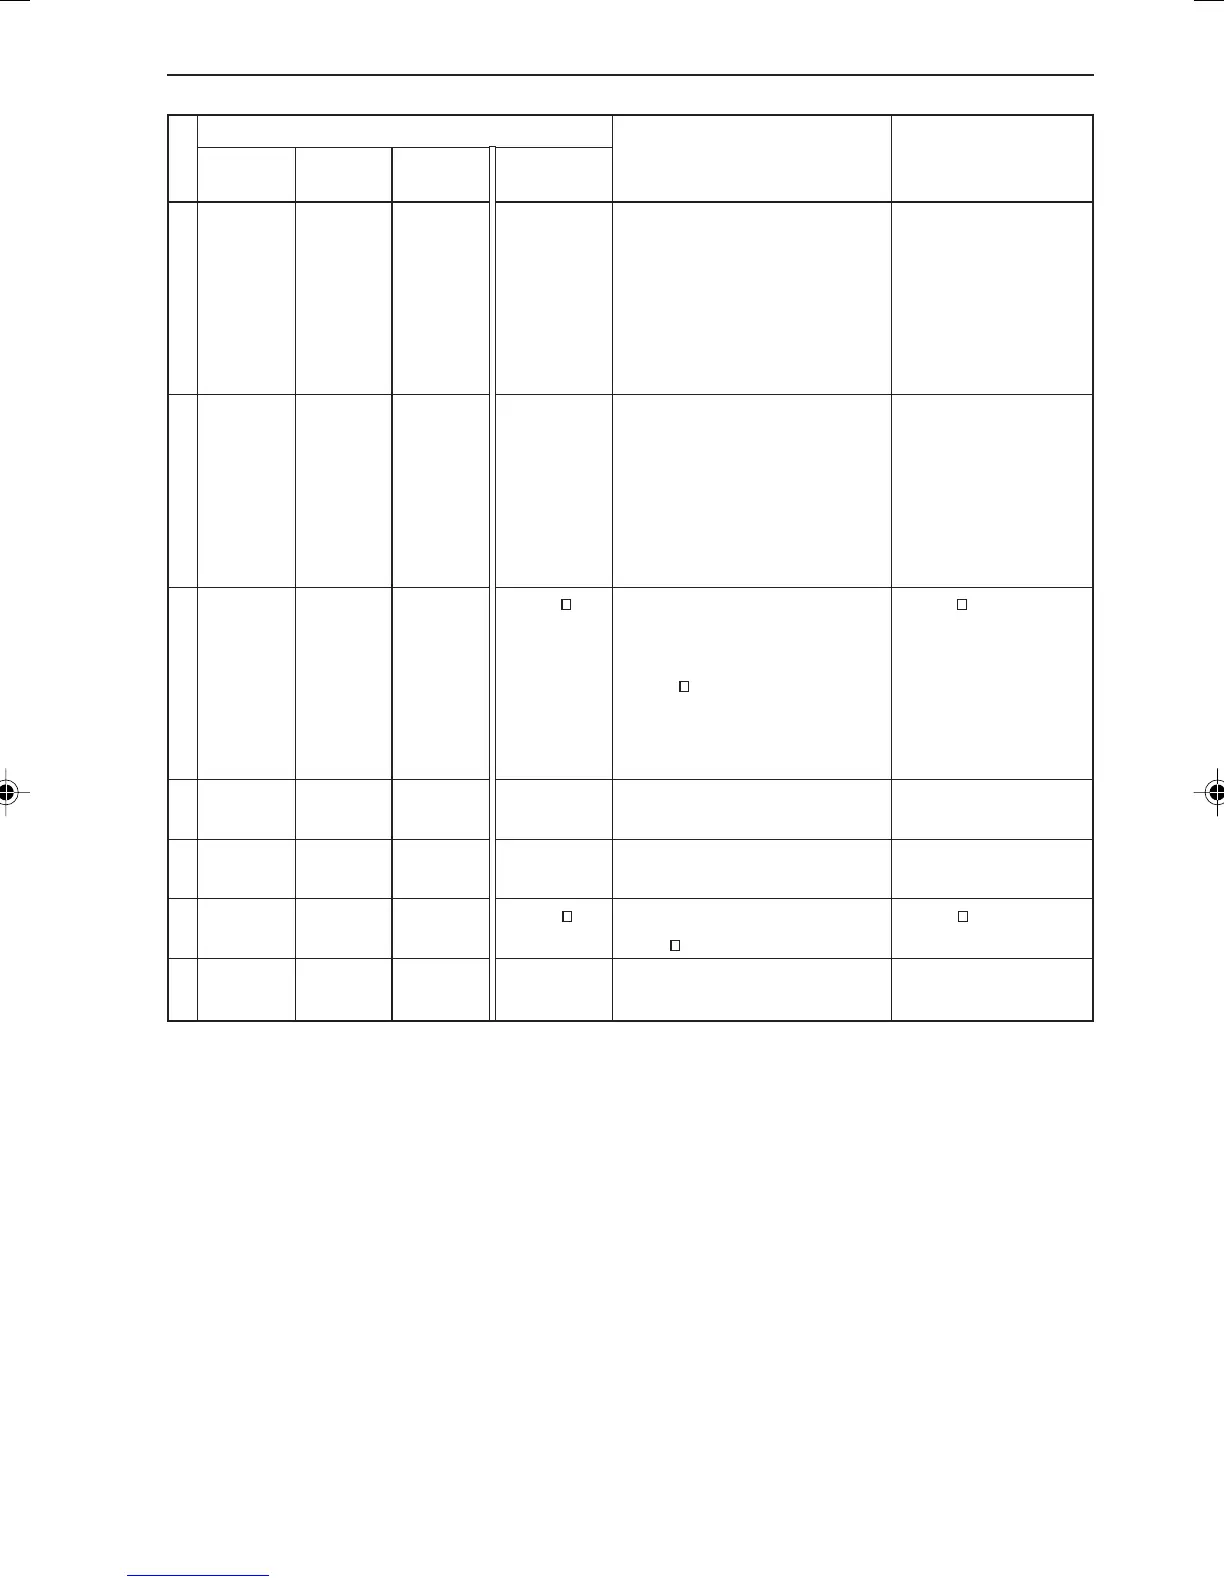
STAT F MBOX 1 MBox • Specifies modified box plot. MBox •
GRAPH The lines on either side are
(Q3–Q1) × 1.5
Uses “•” to draw data points
(including Xmin and Xmax)
of the lines that are on the
outside
2 MBox + Specifies modified box plot. MBox +
The lines on either side are
(Q3–Q1) × 1.5
Uses “+” to draw data points
(including Xmin and Xmax)
of the lines that are on the
outside
3 MBox
Specifies modified box plot. MBox
The lines on either side are
(Q3–Q1)*1.5
Uses “ ” to draw data points
(including Xmin and Xmax)
of the lines that are on the
outside
G S.D. 1 Scattr • Specifies scatter diagram Scattr •
with “•” as data points
2 Scattr + Specifies scatter diagram Scattr +
with “+” as data points
3 Scattr
Specifies scatter diagram Scattr
with “ ” as data points
H 1 xyLine • Specifies xyLine with “•” as xyLine •
XYLINE data points
EL-9650-Appendix (327-338) 8/1/00, 9:41 AM333