MD-P1 Point Map by Application Number with Point Map Comparison
Supported P1 Applications
MD-P1 Point Map by Application Number with Point Map Comparison
Table 4: MD-P1 Point Map by Application Number with Point Map Comparison to DEM1000, DEM2000
MD-P1
Series**
Apps
2771-
2777
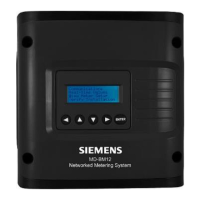
MD-P1 rotary hex switch (MSB and
LSB) on front of meter
P1 Application Number based on
selected CT Current Range
(can only change via WCIS tool)
System Maximum Power Demand
or Peak Demand
- returns max demand value read
since startup or reset of demand
register
System Minimum PowerDemand
- returns min demand value read
since startup or reset of demand
register
System Total True Power =
ABS(kW L1) + ABS(kW L2) +
ABS(kW L3)
System Total Net True Energy LSW
=ABS(kWh L1) + ABS(kWh L2) +
ABS(kWh L3)
System Total Net True Energy
MSW
=ABS(kWh L1) + ABS(kWh L2) +
ABS(kWh L3)
System Average Power Demand
 Loading...