April 21, 2021 30
▪ Note: If these values are reversed, current sensors may have been installed incorrectly (reverse
polarity).
▪ HM = Power detected by the external current sensors on entire home L1 & L2
▪ LD = Power detected using internal sensors on AC grid in/out breaker
• PV Graphical View
o Displays power production over time for the PV array
o Use up/down buttons to navigate between days
o Month view, Year view, and Total view
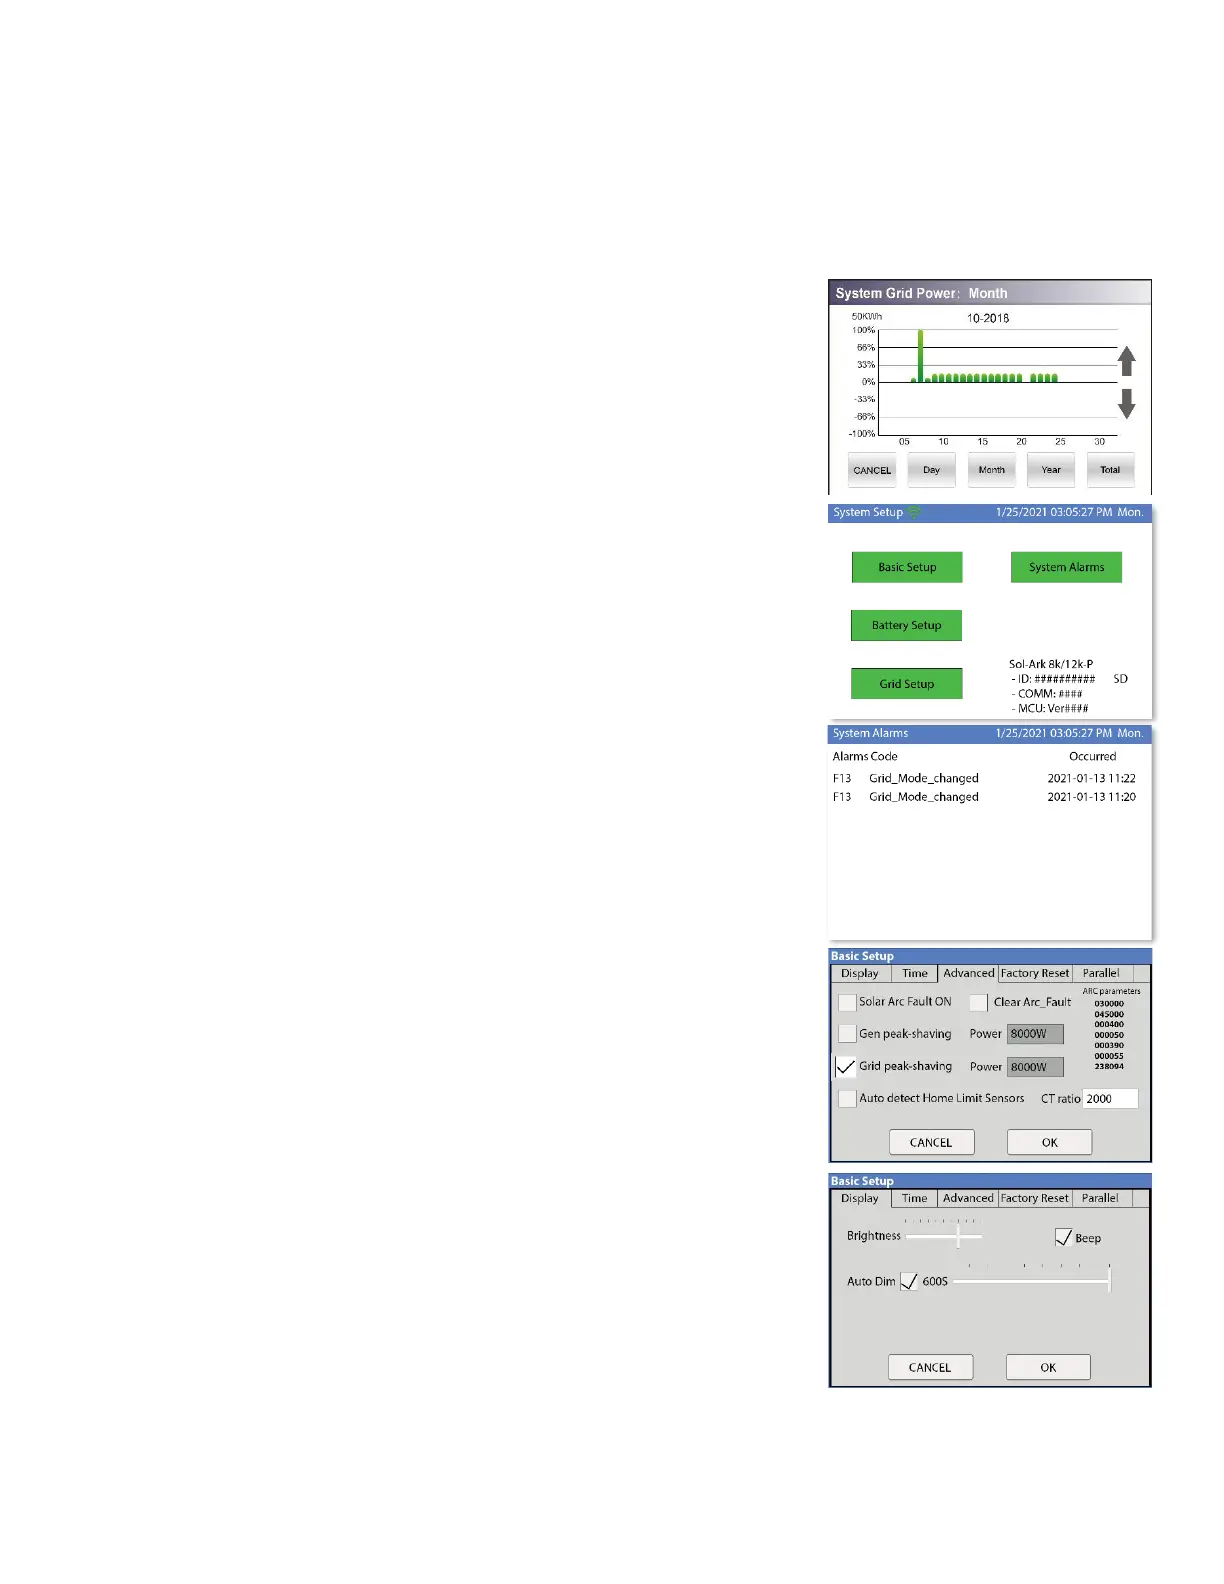
• Grid Graphical View
o Displays power drawn from and sold to the grid over time
o Bars above the line indicate power bought from the grid
o Bars below the line indicate power sold back to the grid
o This view can be helpful in determining when the most power is
used in the home and for time of use programing
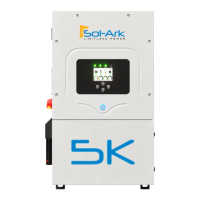
• System Setup Menu
o ID = LCD serial #. But we use the WIFI serial #.
o COMM = LCD software version
o MCU = Inverter software version
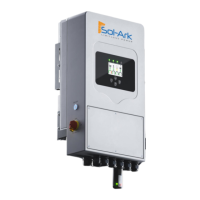
• System Alarms
o Lists all system alarms
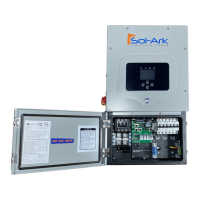
• Basic Setup
o Display
▪ Brightness adjustment
▪ Auto dim (must be enabled for LCD screen to be covered
by warranty)
o Time
▪ Set date and time for the system
▪ 2008174068Alarms & Safety
▪ Arc fault detects if a poor connection in the PV wires
o Grid Peak Shaving
▪ Set the threshold that the Sol-Ark will begin contributing
Power to keep the power drawn from the grid below the
threshold.
o Gen Peak Shaving
▪ Set the threshold at which the Sol-Ark will contribute to
the generator to prevent large loads overloading the
generator.
• Batt Setup
o Batt
▪ Batt Capacity: enter the size of the battery bank
connected to the system
▪ Max A charge: set the max charge rate for the batteries
(This also sets PV → Battery charge rate)
▪ Suggest 20%-30% of battery capacity for lead acid