Solarwise SWF850 QuickStart/Troubleshooting Manual 22 / 73
4.5 Summary
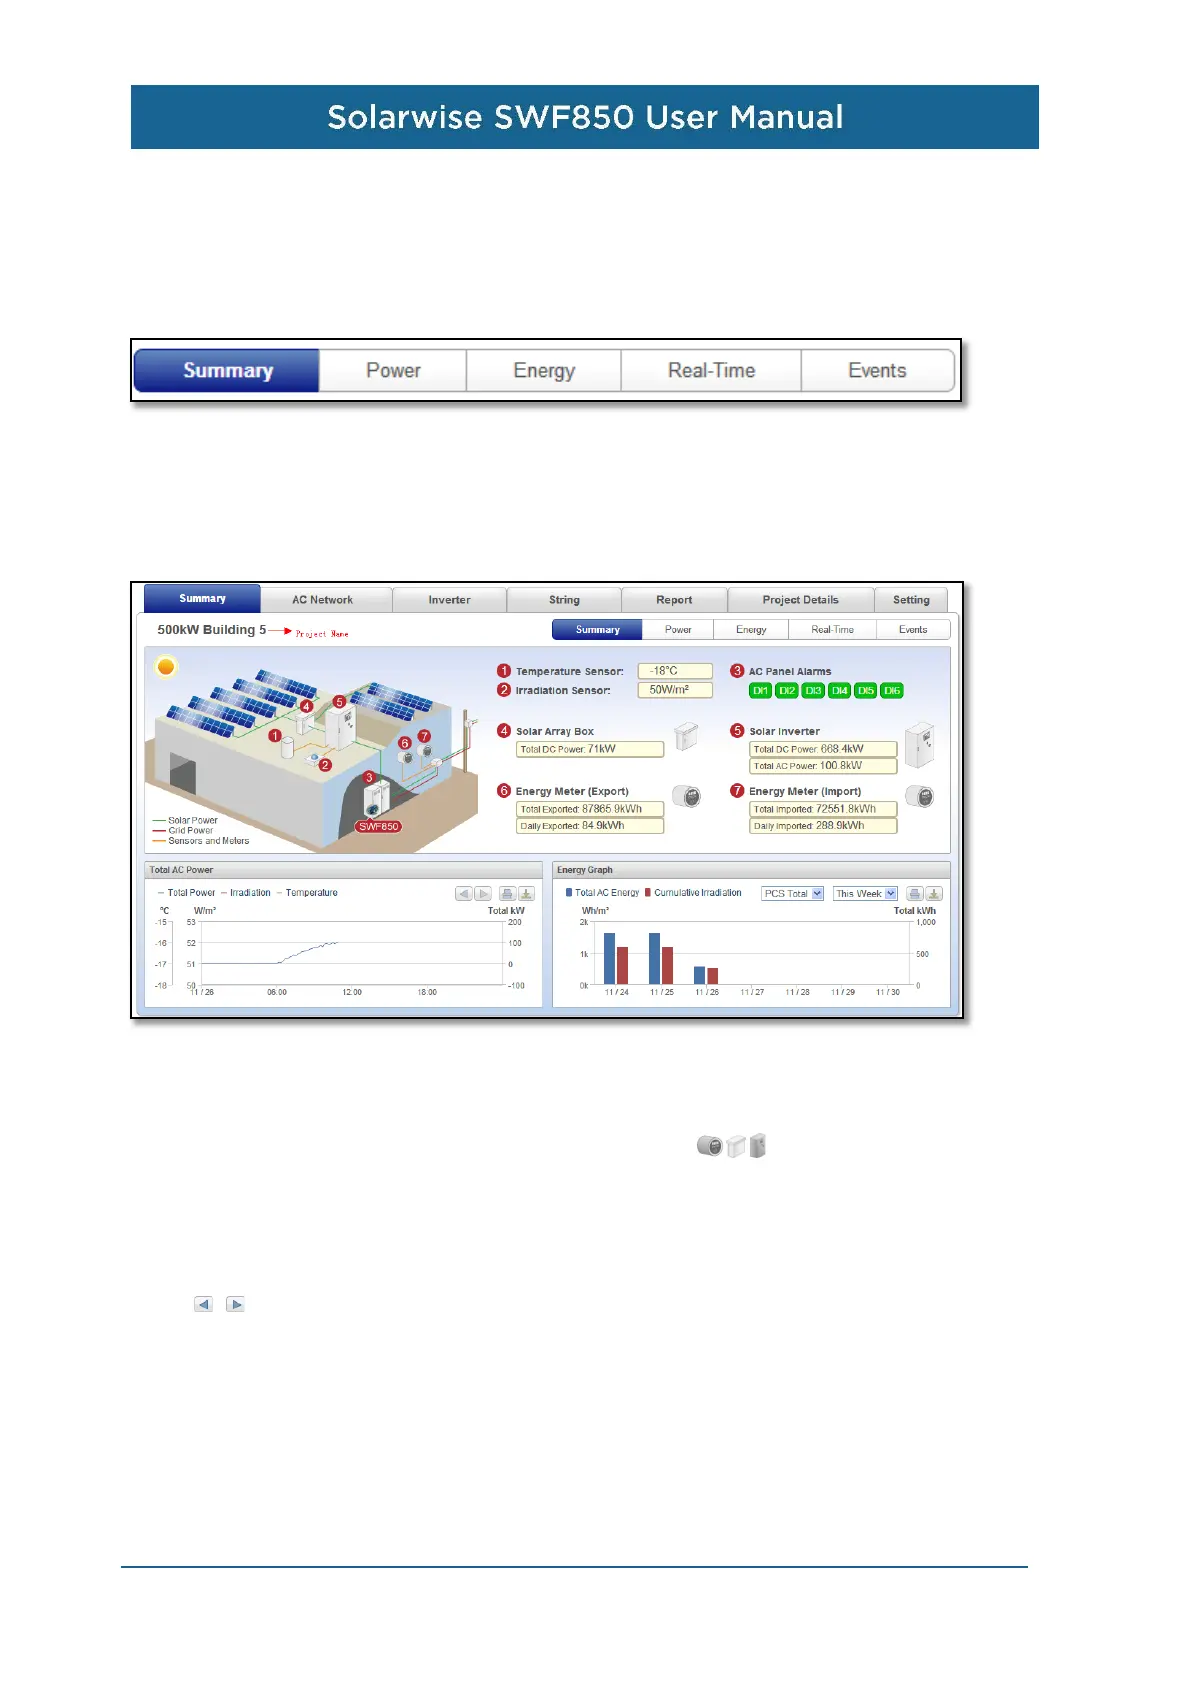
There are five sub-menus shown below in the main menu.
4.5.1 Summary
The photo below shows the summary data and graph of the entire solar farm. Its inclusive
information is rather abundant.
First, under the project name, the user can see the general image and some important data of the
project. The left image can be changed by the menu “Setting-> Global Setting->Summary Image”.
The button from 1 to 7 can be clicked one by one to enter the link page. Some important data of the
project will be display on the right, the button on the right like: also can be click to enter the
link page. The project name can be set by the menu “Setting-> Global Setting ->Project Details”.
Then, on the lower left is the total AC power graph. The graph shows the values of AC Total power
of inverter, Irradiation, Temperature at every 10 minutes. The messages for every data dot will pop
up to show its generating date and time, and the value when the mouse is moved on the graph. The
button can be clicked to see the graph of the previous day and next day. The “print” button is
used for print the graph, the “download” button is used for download PNG, PDF or CSV document.
On the lower right is the energy graph. This graph shows the bar graph of Total AC Energy and
Cumulative Irradiation. There is two drop-down boxes: one is for selecting the energy device of PCS
total, Import, Export, or Load, the other one is for period type of this week, the last 6 months, the last
12 months, and all years.
The graph plots the bar every day on “this week”.
The graph plots the bar every month on “6 month” and “12 month”.