Solarwise SWF850 QuickStart/Troubleshooting Manual 25 / 73
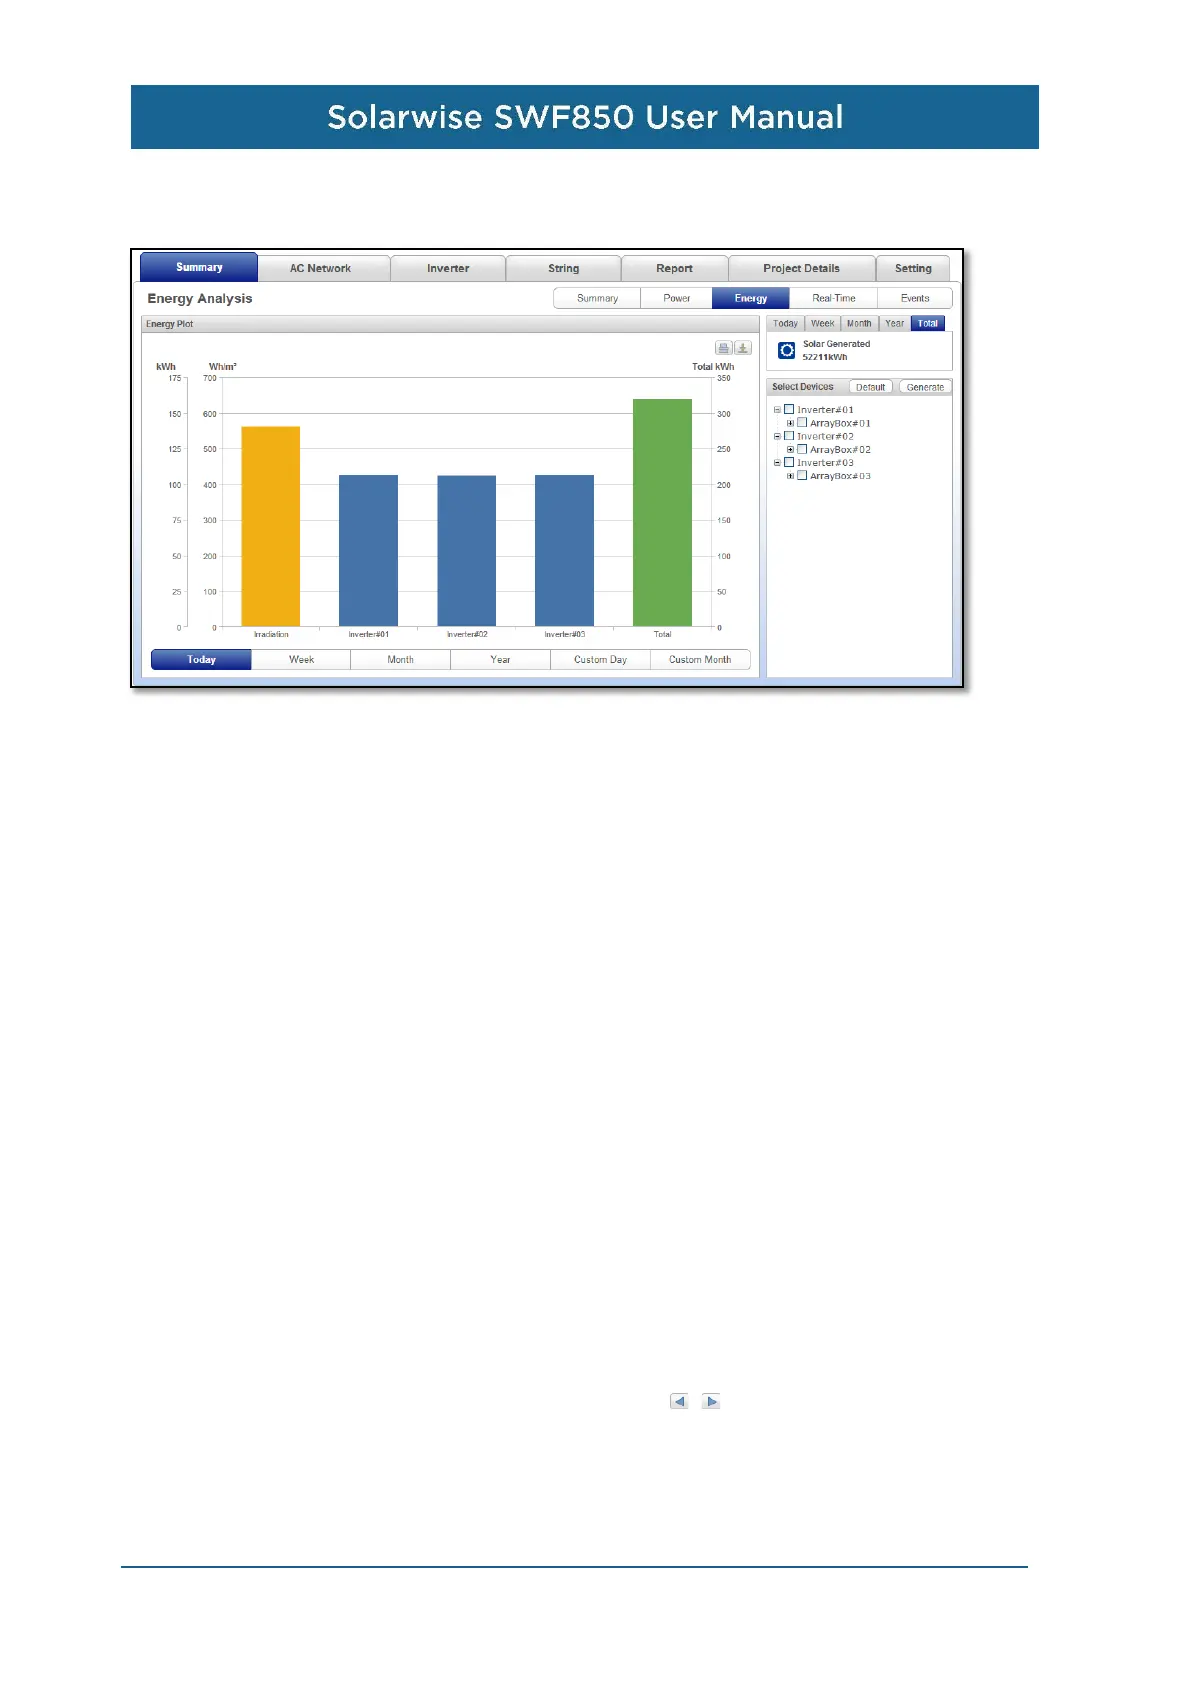
On the top right corner, the solar generated energy will change to accord with the time tab above
switched.
Then, under the generating power diagram, there is the graph which could show the energy bar
graph of the selected equipments comparing with the cumulative irradiation. In the device list on the
right hand, there are three level equipments to be selected, from inverter, array box to string. Only
the same type of the equipments can be selected at the same time to compare with each other, but
the different type can’t.
On the bottom of the graph, user can click the period buttons to see cumulative energy on different
period, including today, week, month, year, custom day and custom month.
4.5.4 Real-Time
This page displays the real time information read from the inverter and arraybox. There are three
portions in this page.
On the right hand is in the device list, there are three level equipments to be selected, from inverter,
array box to string.
The upper left portion is some real time data of the device selected on the device list. There is one
technology name need to be explained. It is the “achieve rate” which is the percentage of the instant
AC power compared with the rated power of inverter.
The lower left portion is the daily graph. Some important data are plotted to line graph at every 10
minutes. The messages for every data dot will pop up to show its generating date, time, and the
value when the mouse is moved on the graph. The button can be clicked to see the graph of
the previous day and next day. The “print” button is used for print the graph, the “download” button is
used for download PNG, PDF or CSV document.
 Loading...