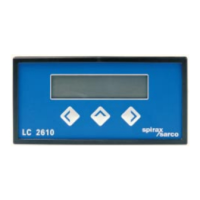
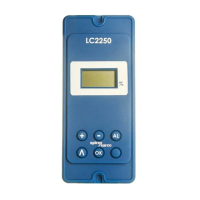
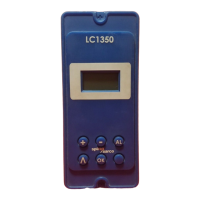
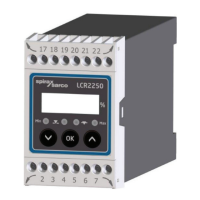
PV
AL
Fig. 3 PV (level %) bar graph definitions
Fig. 5 Alarms bar graph definitions
Highest process variable reached
This can be reset by entering the commissioning mode.
Lowest process variable
This can be reset by entering the commissioning mode
Current process variable
Graphical representation of the process variable in terms of
percentage of full scale.
High alarm level
Low alarm hysteresis
High alarm hysteresis
Low alarm level
SP
High limit or top of proportional band
Low limit or bottom of proportional band
Set Point
Fig. 4 Set Point bar graph definitions
 Loading...
