14
Trend screen
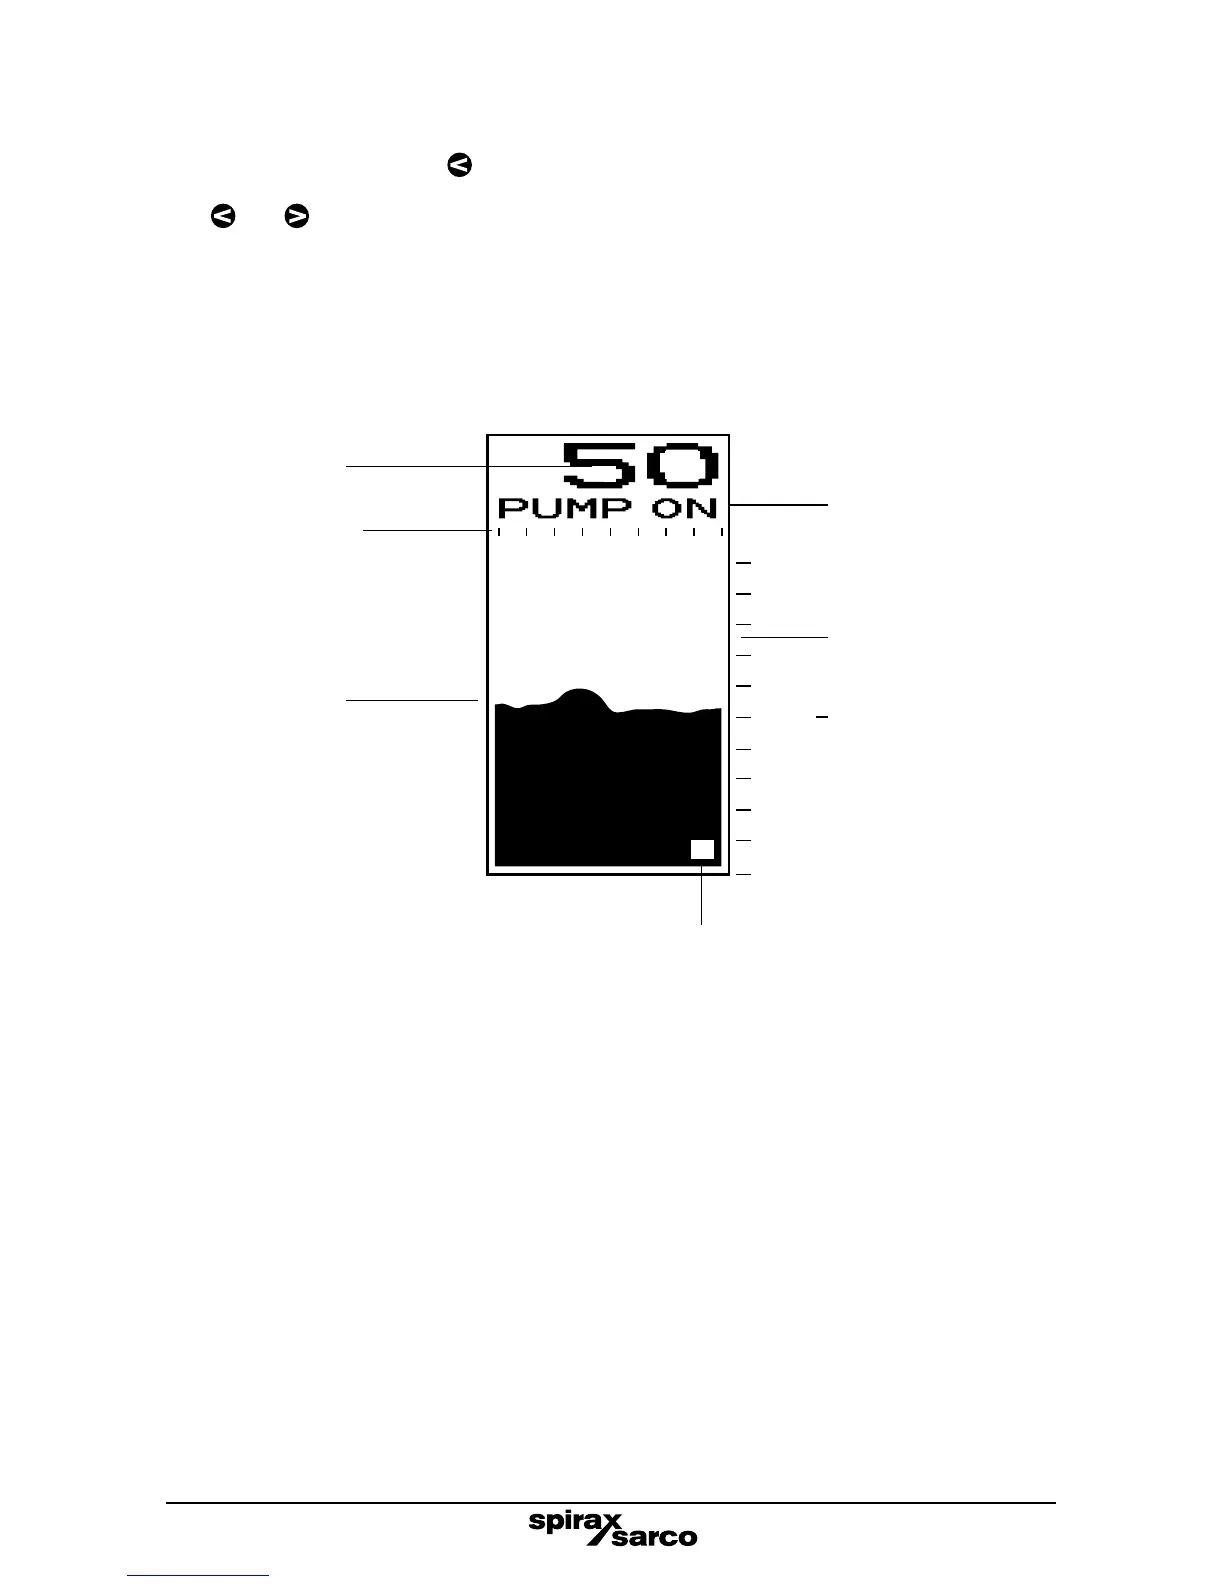
A trend graph appears if the button is pressed in run mode.
The and buttons are used to toggle between the run mode and trend graph.
The trend graph displays a record of the variation in level over a set time. The most recent
event / value is to the left of the graph.
Time can be set in minutes, hours or days, up to 8 units. Time base setting is carried out via
the TREND menu.
100%
50%
0%
M
Parameter value
Information line
Percentage scale
Timescale designator
M = Minutes
H = Hours
D = Days
Timebase markers
Minute or hour or day
PV% value now
PV% value
8 minutes
(or hours or days ago)
Fig. 8 Graphics display definitions - Trend graph mode