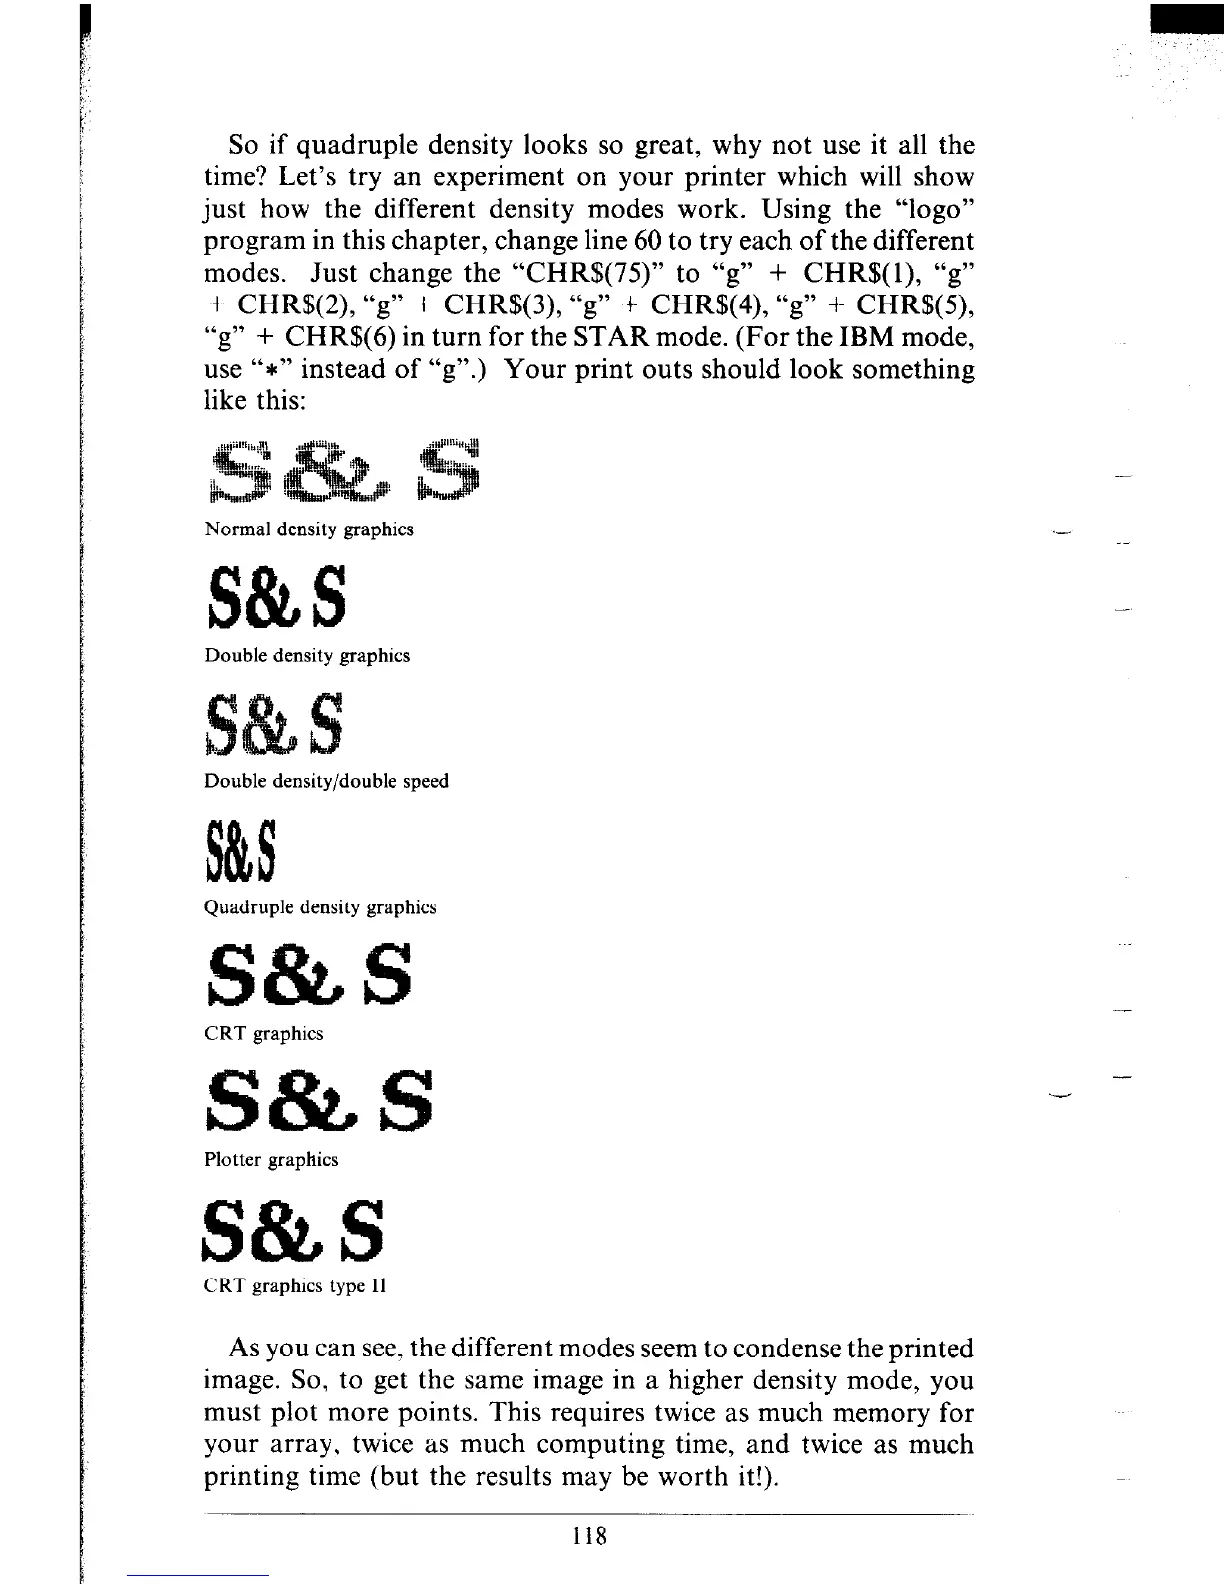
So if quadruple density looks so great, why not use it all the
time? Let’s try an experiment on your printer which will show
just how the different density modes work. Using the “logo”
program in this chapter, change line 60 to try each of the different
modes. Just change the “CHR$(75)” to “g” + CHR$(l), “g”
+ CHR$(2), “g” + CHR$(3), “g” + CHR$(4), “g” + CHR$(S),
“g” + CHR$(6) in turn for the STAR mode. (For the IBM mode,
use “*” instead of “g”.) Your print outs should look something
like this:
Normal density graphics
S&S
Double density graphics
Double density/double speed
Quadruple density graphics
CRT graphics
S&S
Plotter graphics
S&S
CRT graphics type II
As you can see, the different modes seem to condense the printed
image. So, to get the same image in a higher density mode, you
must plot more points. This requires twice as much memory for
your array, twice as much computing time, and twice as much
printing time (but the results may be worth it!).
118
.-
-