4-1
4. PLOTTER
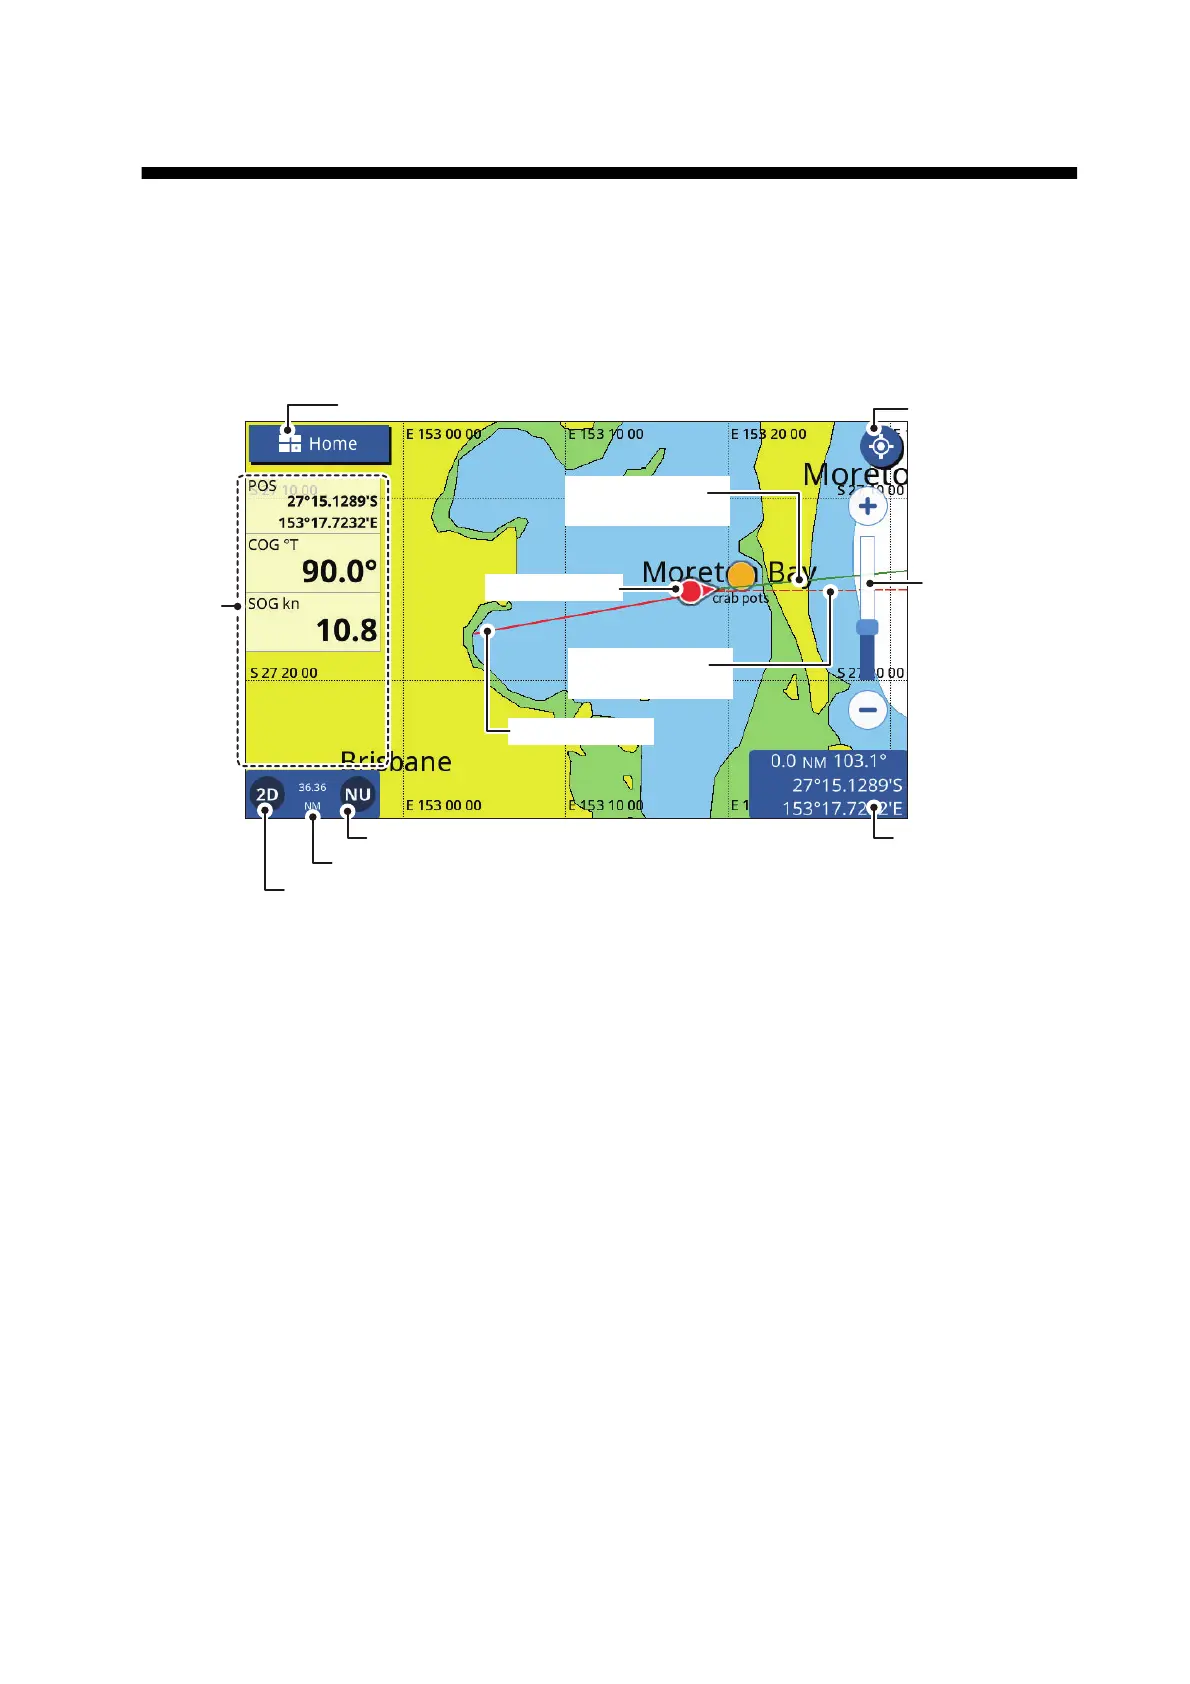
4.1 Plotter Overview
The Plotter page can be displayed in full-screen, or with the Radar, Fish Finder or In-
struments pages.
4.2 How to Select a Chart Type
You can select one of four chart types for your plotter page. The available chart types
are [Vector], [Shaded Relief], [Satellite] and [Raster Chart].
1. Swipe the bottom of the plotter page upwards to show the layered menu.
2. Tap [Chart Type] to show the chart types.
3. Tap the chart type you want to use.
4. Tap the [<] icon at the top-left of the chart type list.
5. Swipe the layered menu downwards to close the menu.
COG Vector
(red dashed line)
Heading line
(green solid line)
Cursor data boxPresentation mode
Data
area
Display range
2D/3D icon
Note: When the unit for Depth (see section 12.2) is set to pb or HR, the following
changes are also applied to the displayed depth values.
• The depth value shown in the data area and on the fish finder screen appears in
pb/HR.
• The depth values shown on the chart appears in m (meters).
• The depth values for Underwater Objects/Display Limit filters are changed to
pb/HR, however the chart-displayed values remain in m (meters).
Center icon
(returns own ship
to screen center)
Range
slide
bar
Own ship track
Own ship icon
[
Home
]
icon