OutputTemperatureChart
49│Page
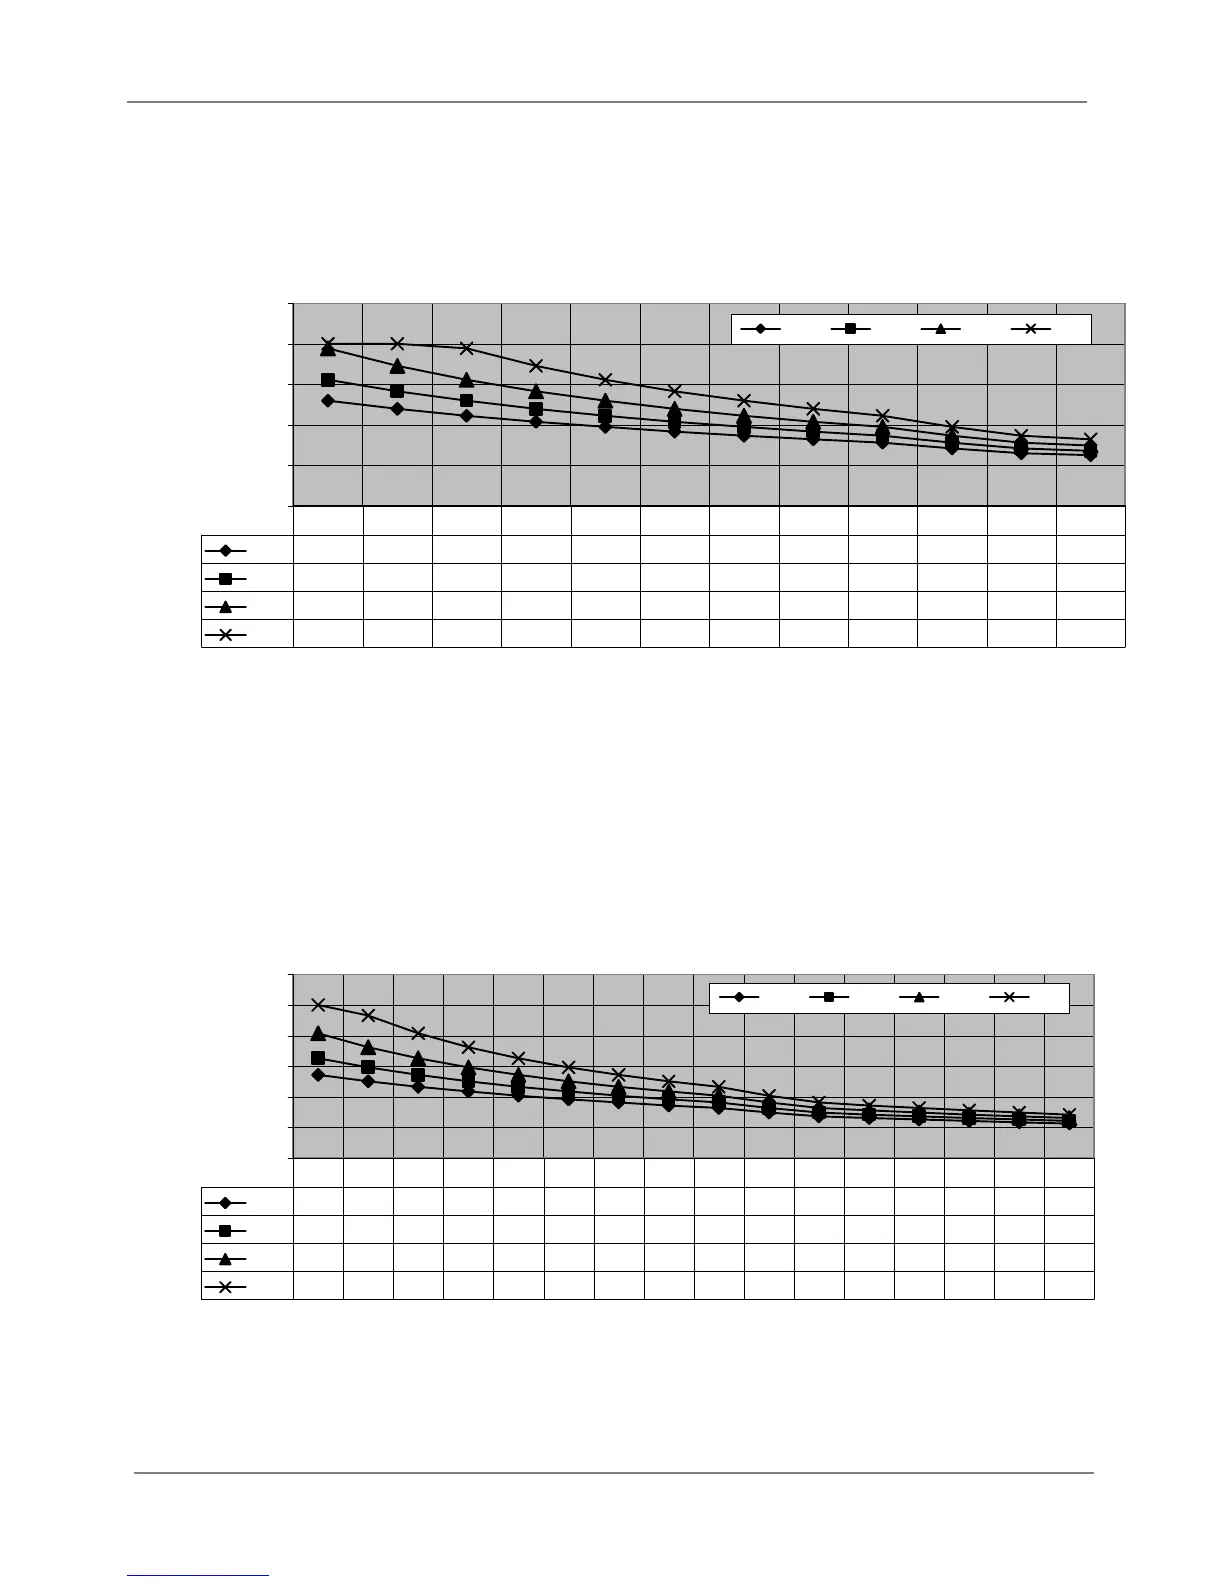
Output Temperature vs. GPM (Max. 8.0 GPM) with Various Inlet Water Temperature
0.0
2.0
4.0
6.0
8.0
10.0
Out Put Hot Water GPM
40 F 50 F 60 F 70 F
40 F
5.2 4.8 4.4 4.1 3.9 3.7 3.5 3.3 3.1 2.8 2.6 2.5
50 F
6.2 5.7 5.2 4.8 4.4 4.1 3.9 3.7 3.5 3.1 2.8 2.7
60 F
7.8 6.9 6.2 5.7 5.2 4.8 4.4 4.1 3.9 3.5 3.1 3.0
70 F
8.0 8.0 7.8 6.9 6.2 5.7 5.2 4.8 4.4 3.9 3.5 3.3
100 105 110 115 120 125 130 135 140 150 160 165
Output Temperature vs. GPM (Max. 10.0 GPM) with Various Inlet Water Temperature
0.0
2.0
4.0
6.0
8.0
10.0
12.0
Out Put Hot Water GPM
40 F 50 F 60 F 70 F
40 F
5.4 5.0 4.7 4.3 4.1 3.8 3.6 3.4 3.3 3.0 2.7 2.6 2.5 2.4 2.3 2.2
50 F
6.5 5.9 5.4 5.0 4.7 4.3 4.1 3.8 3.6 3.3 3.0 2.8 2.7 2.6 2.5 2.4
60 F
8.1 7.2 6.5 5.9 5.4 5.0 4.7 4.3 4.1 3.6 3.3 3.1 3.0 2.8 2.7 2.6
70 F
10.0 9.3 8.1 7.2 6.5 5.9 5.4 5.0 4.7 4.1 3.6 3.4 3.3 3.1 3.0 2.8
100 105 110 115 120 125 130 135 140 150 160 165 170 175 180 185
*Whenthesettemperatureis131
F orhigher,maximumflowrateislimitedto8.0GPM.
<T‐D2‐IN/OS>
<T‐K4‐IN/OS>
 Loading...