●
Menu Display Using the Mouse
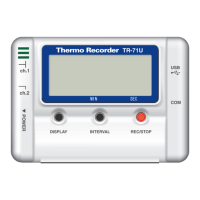
By right clicking on the list, the Menu will be displayed.
◆
Data List Display : From the
[
View
]
Menu
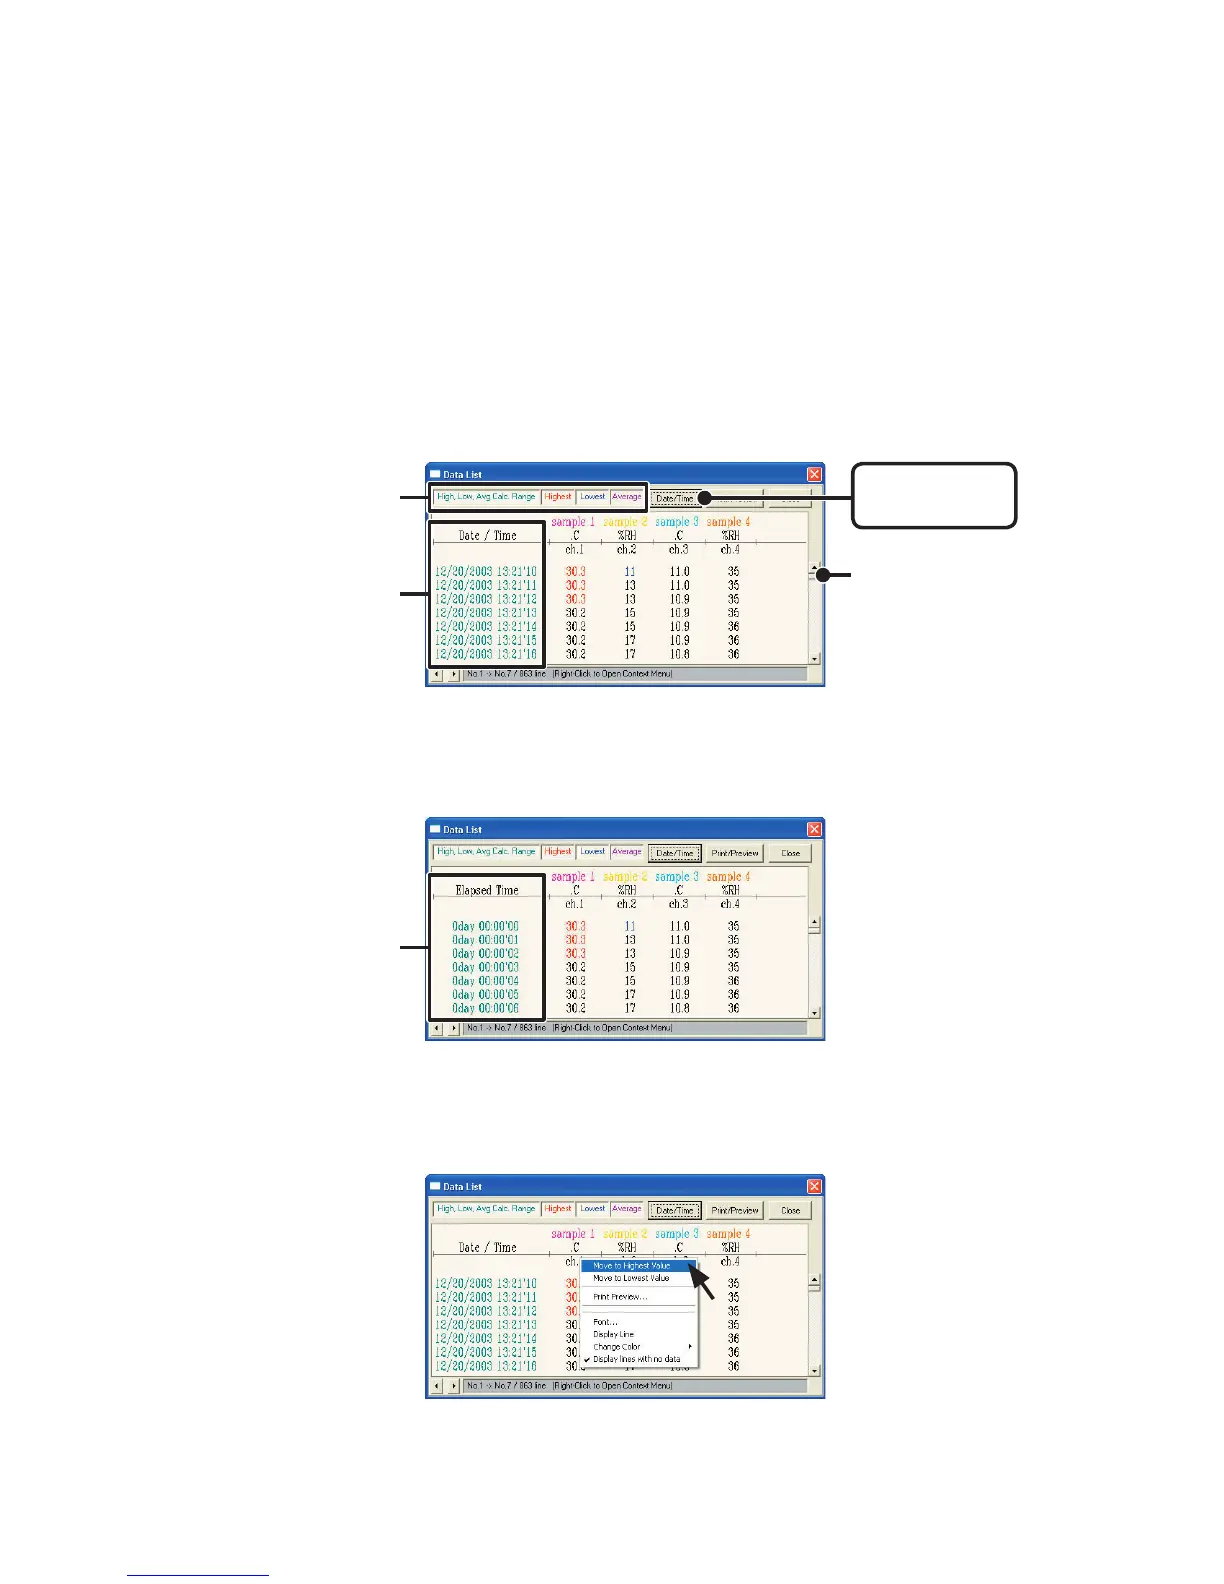
This is a list of the data that was displayed in graph form.
●
[
Date
/
Time
]
Button
By clicking this button, you can shift the display between the recorded
date and the amount of elapsed time since recording started.
28
①
The highest value is in RED, lowest is in BLUE, and the average is in PINK.
②
Scroll Bar : By dragging it up and down you can move to the data you want.
[
Date
/
Time
]
button
②
①
Recorded Date
Display
Elapsed Time
Display