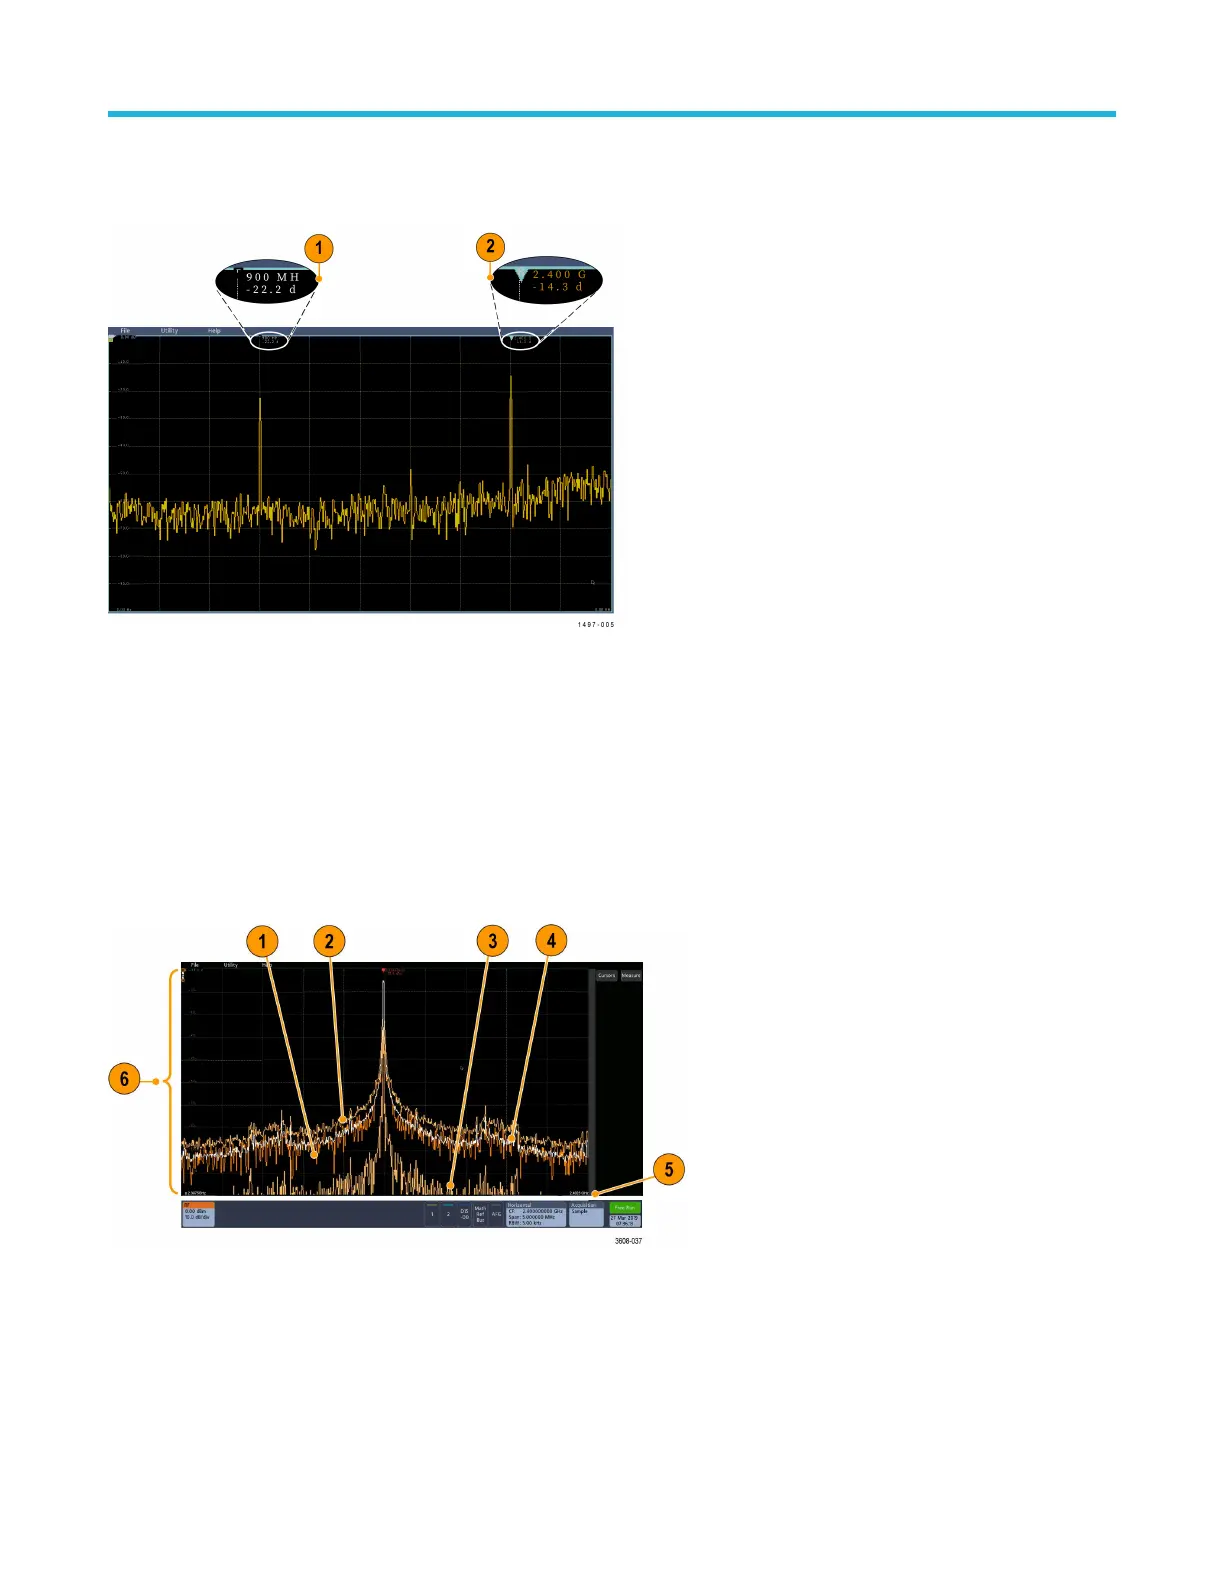
Spectrum trace markers
Automatic peak markers assist with quickly identifying the frequency and amplitude of peaks in the spectrum trace.
Figure 6: Spectrum trace markers
1. The Reference Marker is placed on the highest amplitude peak. It is marked with a Red triangle.
2. The Automatic markers mark the next highest peaks in the trace.
•
The automatic markers indicate frequency and amplitude.
• Absolute readouts show the actual frequency and amplitude of the automatic markers.
• Delta readouts show the frequency and amplitude of the automatic markers relative to the reference marker.
The RF waveform view user interface
This topic identifies objects in the RF waveform view.
1. Normal trace: Each acquisition is discarded as new data is acquired.
2. Max hold trace: The maximum data values are accumulated and displayed over multiple acquisitions of the Normal trace.
3. Min hold trace: The minimum data values are accumulated over multiple acquisitions of the Normal trace.
4. A
verage trace: Data from the Normal trace is averaged over multiple acquisitions. This is true power averaging, which occurs before
the log conversion. Each power of 2 averaging reduces the displayed noise by 3 dB.
5. Amplitude (magnitude) scale.
Waveform acquisition concepts
3 Series Mixed Domain Oscilloscope Printable Help 241
 Loading...