10: Capturing and analyzing waveforms Model DMM7510 7½ Digit Multimeter
10-10 DMM7510-900-01 Rev. C / September 2019
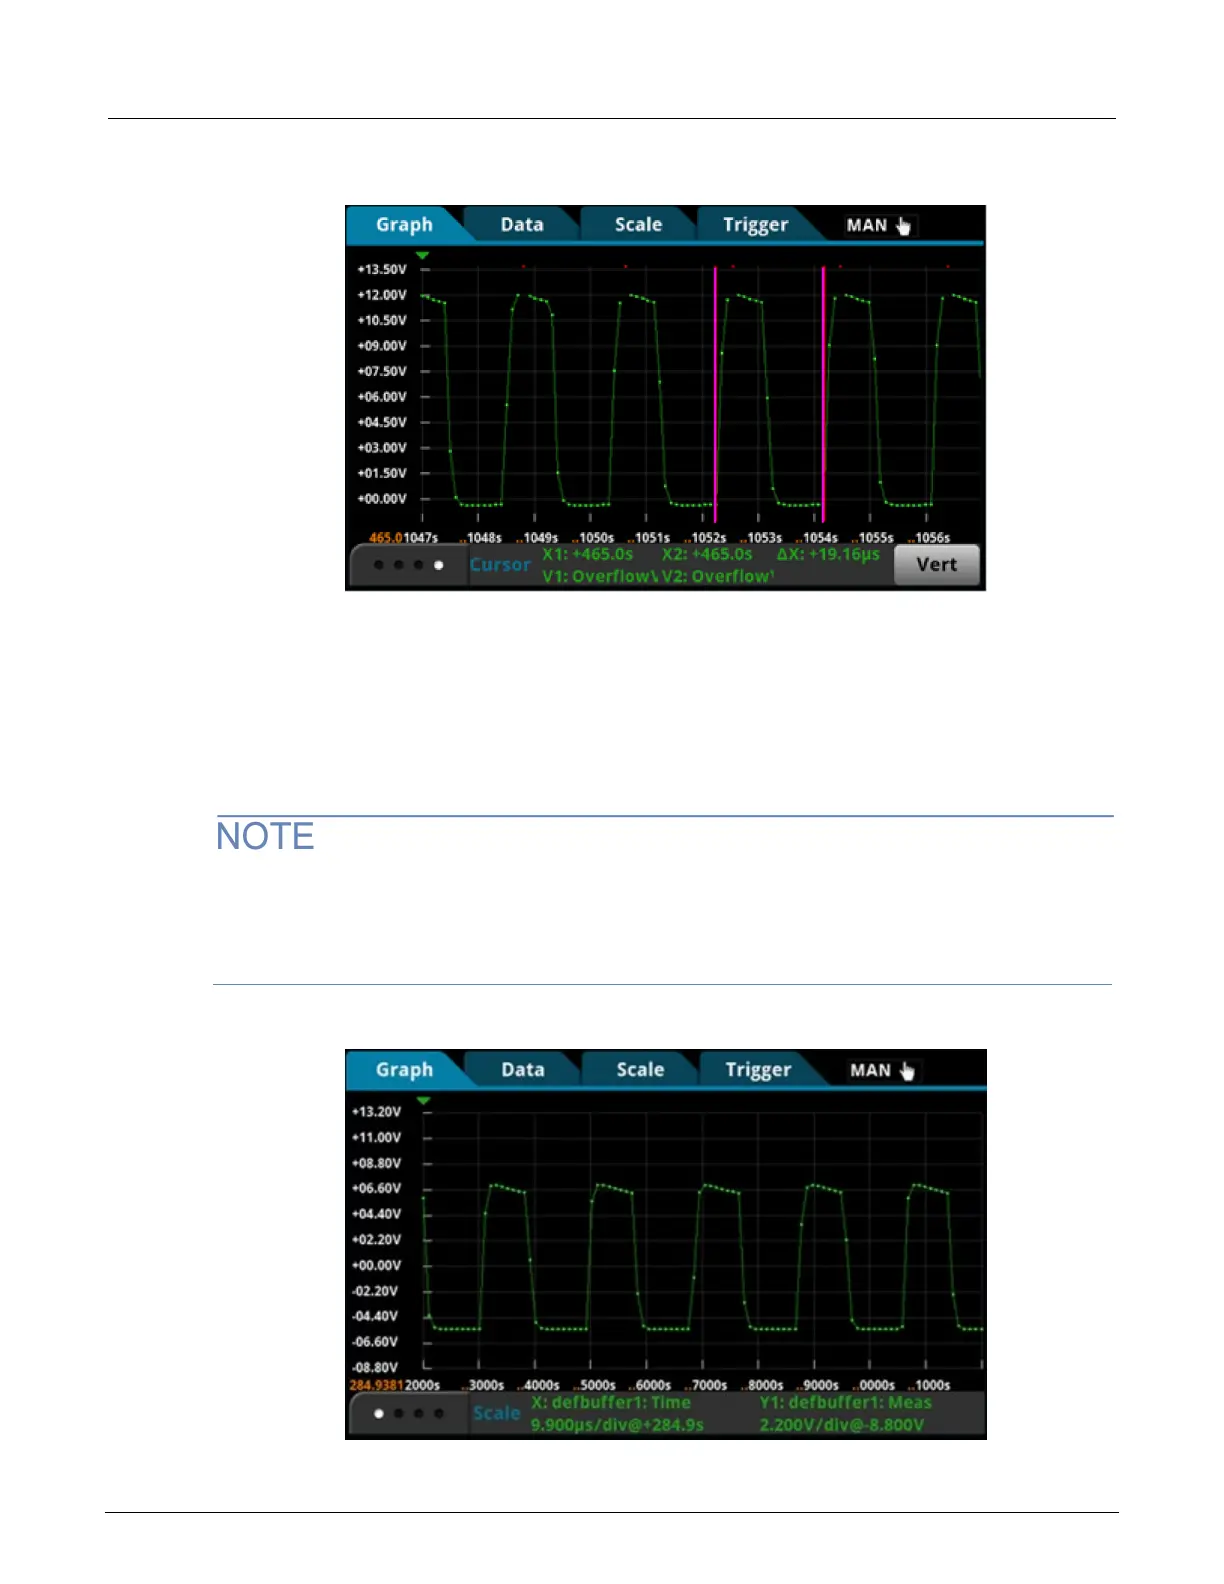
Figure 41: Duty cycle 2
• ∆high = 8.029 μs
• ∆period = 19.16 μs
• Duty cycle = 8.029 μs /19.16 μs = 40%
Expected output = duty cycle × input = 40% × 12 V = 5 V
The red dots at the top of the cycles indicate an overflow condition, which occurs because the 12 V
measurement is over the 10 V measurement range. Instead of increasing the range to 100 V, which
reduces the analog bandwidth to 6 kHz, you can change the signal coupling to AC to maintain the
bandwidth integrity. Refer to the following screen capture of the AC coupled waveform.
Figure 42: Graph with AC signal coupling
 Loading...