An segmented into 60 x 1 minute segments scroll across the display (when
enabled). The event time line is displayed as a graphical scale ranging over 0-1.00 m/sec that
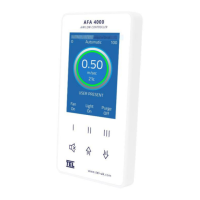
progresses across the screen, representing the airflow value at each segment.
The segment colour changes, as follows, if the value is in the range of an airflow alarm:
The alternative to the event time line is a dynamic representing the airflow velocity.
The output status is permanently displayed under the bar graph or event time line as either
Manual or Automatic. If the controller is configured to dual set-point mode, the status is
displayed as Manual, High Set Point or Low Set Point.
The display shows an up and down arrow icon, , in the bottom right hand corner of the
screen when an input function is set to Hi / Lo (2 speed operation). The up arrow indicates High
speed and the down arrow indicates Low speed.
• The display shows a Horn icon (with a line across it) when the audible alarm is muted.
• The display backlight dims to save energy when the following functions are in use:
• Fan Off activated - display backlight dims until Fan On is selected.
Backlight brightens to normal level when you access the Set Up or Diagnostics menus.
• Setback activated - display backlight dims until the Setback is deactivated.
Backlight brightens to normal level when you access the Set Up or Diagnostics menus.
• Min Pushbutton activated – display backlight dims until Pushbutton III is set to Run or
Max. Backlight brightens to normal level when you access the Set Up or Diagnostics
menus.
• Auto Dim Screen velocity is exceeded - display backlight dims if the airflow is above the
set value. Backlight brightens to normal level when you access the Set Up or Diagnostics
menus.